Site24x7 Control Panel
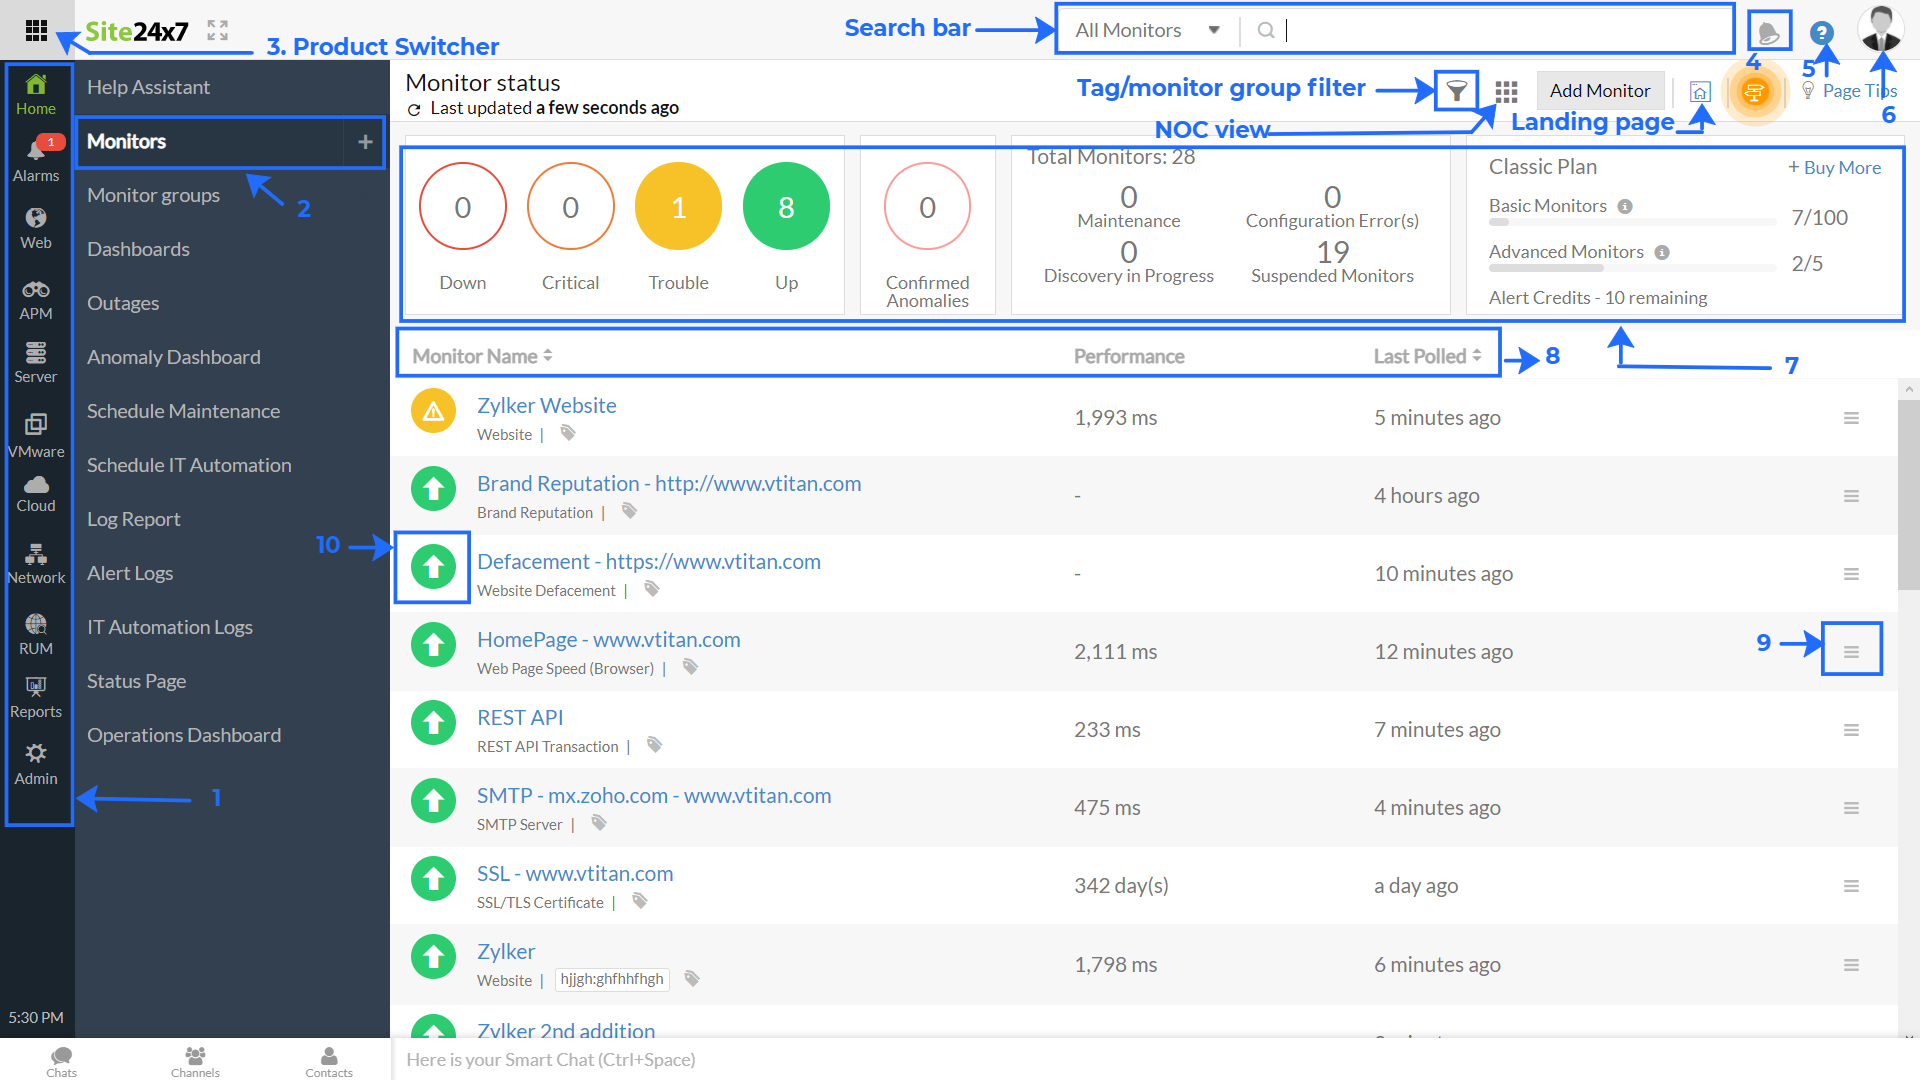
Here is a quick overview of standard icons and controls available when using your Site24x7 Control Panel. You can explore this section to understand more about the new Site24x7 user interface, icons and functions.
Site24x7 Client Control Panel - 1 (Legends 1 to 13)
| Control Panel Functions | Description |
|---|---|
| 1. Dock & Dock icons | All your monitor dashboards, reports, and administrative tasks are segregated separately based on their intented function and listed under various Dock icons. Dock icons: Home, Web, Server, APM, Reports, Cloud, and Admin. Dock: All your Dock icons together constitute the "Dock". You can view the "Dock" on the left side pane of the web client. Use the Dock to navigate among various dashboards and perform administrative tasks in the web client. |
| 2. Tab | Click on any individual Dock icon to view their relevant Tabs. A Tab takes you to a relevant dashboard or lets you to execute your intented operation inside the client. |
| 3. Product Switcher Mode | Move the mouse cursor to the top-left corner of your screen to view the  icon. Click this icon to access multiple Site24x7 products like CloudSpend (BETA) and Signals (BETA) instantly. icon. Click this icon to access multiple Site24x7 products like CloudSpend (BETA) and Signals (BETA) instantly. |
| 4. Alert Notifications Badge | View all your real-time notifications to the client inside the "Alert Notifications". This is without the need to refresh the page. |
| 5. Help and Support |
Click on this icon to learn more about Site24x7 through various resources like Help Docs, Knowledge Bases, Videos, Forums, Support and Chat. Additionally, you can also request for product demos, view our webinars and learn more about What's new in Site24x7. |
| 6. Profile | View your complete Site24x7 profile information including Account, Subscription, and Free Tools. You can also connect to Site24x7 via various online social media sites. Switch between the light or dark themes by using the option Turn On Night Mode. Click Logout to exit from the Site24x7 webclient. |
| 7. Status Banner |
It gives you a real-time status of all your configured monitors. All monitors are categorized based on their current operational status. Down monitors are grouped in red, Critical in orange, Trouble in yellow, Up in green, and Confirmed Anomalies (in the last one hour) in pink colors. Clicking on Confirmed Anomalies will redirect you to the Anomaly dashboard. It also showcases the total monitor count under configuration error(s), under maintenance, suspended, and those still under discovery. You can also view monitors based on basic and advanced categories. Learn more. |
| 8.Dashboard Title | This is always relative and changes from one dashboard to the other. The dashboard title normally reciprocates the metrics captured by the monitor. |
| 9.Hamburger Icon | Click on this |
| 10.Live Monitor Status |
Identify the real-time status of your configured monitor. Following are the "Status icons." |
|
|
|
|
|
|
|
|
|
|
|
|
|
|
|
|
|
|
|
|
|
 Suspended Status: This icon reflects the suspended state of your monitor. Suspended Status: This icon reflects the suspended state of your monitor. |
|
| Feedback |
Instantly share your feedback and suggestions on Site24x7 client with our built-in feedback form. |
| Time Zone Settings |
All Site24x7 admin actions including report generation and other critical activities use the time zone that you have selected for your account. View your configured "Time Zone" at the bottom left corner of your Control Panel. To change the time zone inside the Site24x7 client, navigate to My Account > Account Settings > Choose the required "time zone" from "Time Zone for Reports" drop down. Note
Your time zone setting controls the dates and times that appear on your Site24x7 pages, dashboards, and REST APIs. By default, Site24x7 uses (-8:00) pacific standard time (PST). |
| Hour Format for Reports |
For the time displayed in your charts and reports, you can now set the hour format to be followed.You can choose either a 12-hour format or 24-hour format using the 'Hour Format for Reports' option. To change the Hour Format inside the Site24x7 client, navigate to My Account > Account Settings > Choose the required hour format from "Hour Format for Reports" option by using the toggle button. |
| Full screen Mode |
Move your mouse cursor to the top of the Site24x7 Control Panel to enter the Full screen mode. This is useful when you wish to focus on certain metrics of your monitor and want to hide the background Dock, Tabs, and other menus. Take your mouse cursor to the top of the control panel again to exit Fullscreen. |
| Dynamic Favicon |
The Site24x7 favicon is highlighted as |
| Favorite Dashboards |
All the dashboards you have marked as favorites will be listed on the left tab. |
Search Bar
Search provides three options for filtering Monitors, Monitor Groups, or Interfaces already added in your account, Admin Actions, and for adding new monitors in your account.
-
All Monitors:
Use this filter to quickly search and view a specific monitor, monitor group, or interfaces from your configured list of monitors, groups, or interfaces based on their name and tags. With the Advanced Search option, you can filter Monitors, Monitor Groups, and Interfaces. Monitors can be filtered using Monitor Name, Tags, Domain name, IP address, Server name, MAC address, OS Type, or the Instance Type. Monitor Groups can be filtered using the Monitor group name. Network Interfaces can be filtered using Interface name.
NoteWhile using tags to search monitors, tags associated with the monitor groups cannot be used to filter monitors present in that group. You can filter out only monitors using tags directly associated with them.
- Admin Actions: Use this filter to get the navigation path and perform various actions listed under the Admin Tab.
- Add Monitor: Use this filter to navigate to the add monitor form of that corresponding monitor.

Learn more about Site24x7 Search bar and the different search options available.
Landing Page
Landing page is the page to which you 'll be redirected when you log in to Site24x7. And it is a user-level configuration, which means each user in an account can opt for their choice of a landing page.
Currently, we support multiple options (pages) out of which you can choose your landing page. To choose a page as your landing page, go to that page and check for the landing page icon on the top right end of the page. If it's a supported page click on the icon and make it your landing page. Landing Page supported pages are:
- All Monitors Status
- APM Insight Applications
- Server Monitors Status
- Network Devices Status
- VMware Resources Status
- RUM Applications Status
- Internet Service Monitors Status
- Monitor Group Status
- NOC View
- Alarms
- Individual Custom dashboard
- Individual Monitor Group
Site24x7 Client Control Panel - 2
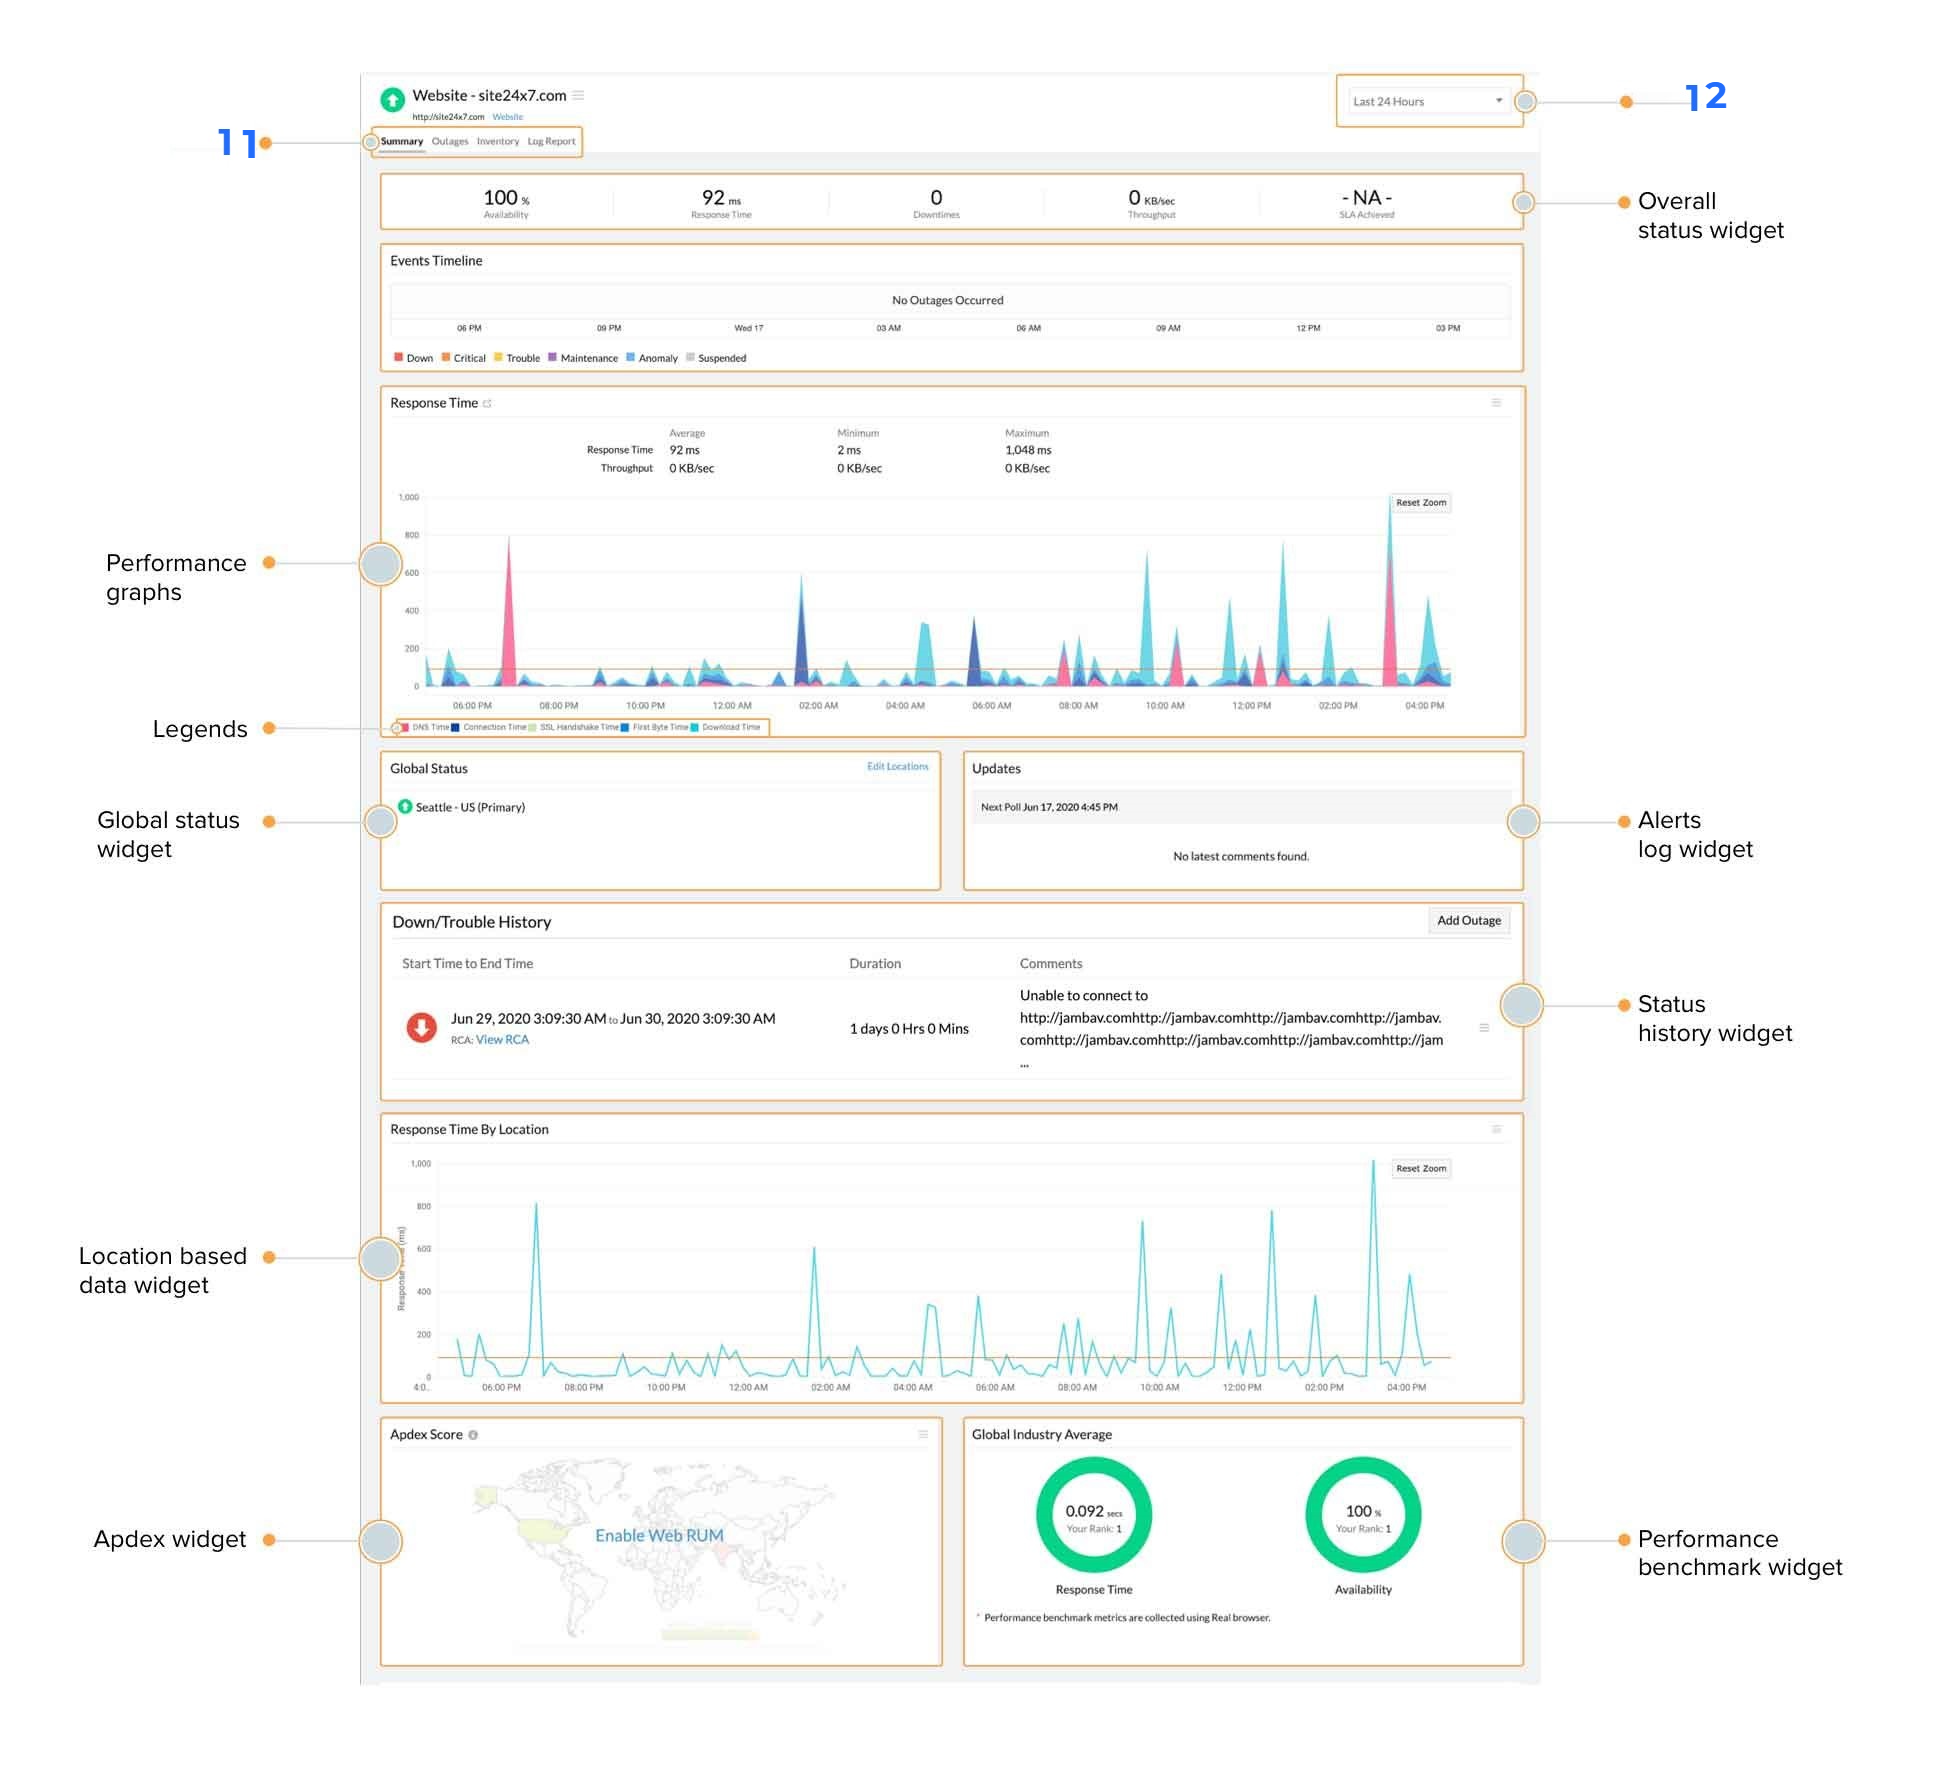
Site24x7 Client Control Panel - 3

| Control Panel Functions | Description |
|---|---|
| 11.Dashboard Tab |
Use the tabs listed in Dashboard Tab to view various supplementary data of your monitor. Available tabs are: Summary, Outage & Trouble Alerts, Inventory & Notes, and Log reports. |
| 12.Time Picker | Select a pre-set time span for extracting your historical data. Choose a time span from the available drop-down options (last 1 hour to a year back). You can also select a "custom period" to choose a cusom range. |
| Overall Status Widget | Instantly view the overall status of your configured monitor. It includes metrics like availability, response time, downtimes & duration, througput, SLA percentage achieved and RCA details. |
| Events Timeline Widget |
Events timeline widget records all the past events of your selected monitor for a selected time range. You can identify/decode various events from the past, which includes Down, Critical, Trouble, Maintenance, Suspended, or Anomalies. Each event are color coded for easy identification. Events can be drilled down to extract maximum data and facilitate easy troubleshooting. It also gives you insight into details like outage duration and exact outage period. |
| Performance Graphs | Performance Graphs help you to drill deep into the performance of your configured monitors. This can also help identify monitors with poor response time and take corrective measures wherever necessary. The average time taken by the monitors to respond to Site24x7 servers, over a specific time period is also shown. |
| Legend | Colored check boxes act as legends for each parameter. These legends help you to visualize the groups inside the chart. Furthermore, the legends act as quick filters and enable you to isolate the parameters in the graph based on your requirement. |
|
Global Status Widget |
View the real-time status of your monitor from global locations. |
|
Alerts Log Widget |
Get log details for your configured monitor. |
|
Location Based Data Widget |
The total availability percentage, response time (ms) and down duration from each monitoring location can be inferred from this widget. |
| Apdex Widget | By using the Apdex industry standard for measuring the satisfaction of a user using your application or service, you can understand how your applications are performing from your users’ perspective, i.e, “Satisfied”, “Tolerating” or “Frustrated”. |
|
Performance Benchmark Widget |
With the performance benchmark widget, you can instantly view and compare your average response time and availability of your service with respect to your industrial peers. This can be viewed across various industry verticals. |
| Tooltip | Tooltip is small pop-up box that appears when the user moves the mouse cursor over an element. Click the tooltip to gain more information about the feature. |
|
Poll Time Picker |
Choose a "polled time" from the available poll periods to extract the historical data of your monitor. |
Current Status - Home Control Panel and Notifications Badge
Site24x7 webclient home screen offers comprehensive and insightful details into various aspects of your monitoring. You can instantly gather detailed reports, identify the status of your monitors or configured monitor groups, obtain information on outages, and much more. Both Monitor and Monitor Group control panels have a refresh button that allows you to refresh and then render the real-time status of your monitors or monitor groups. The control panel however auto-refreshes every five minutes to reflect the current status.
Summary View
If you've configured more than 3000 monitors in your Site24x7 account, you'll be shown the monitor summary view, by default. You'll be able to view the overall monitor summary and status summary. Additionally, you can view the status summary based on monitor types. Suspended monitor status of monitor types will not be shown, though. You can always view the complete monitor list by accessing the View Monitor List link on the top-right corner of the control panel.
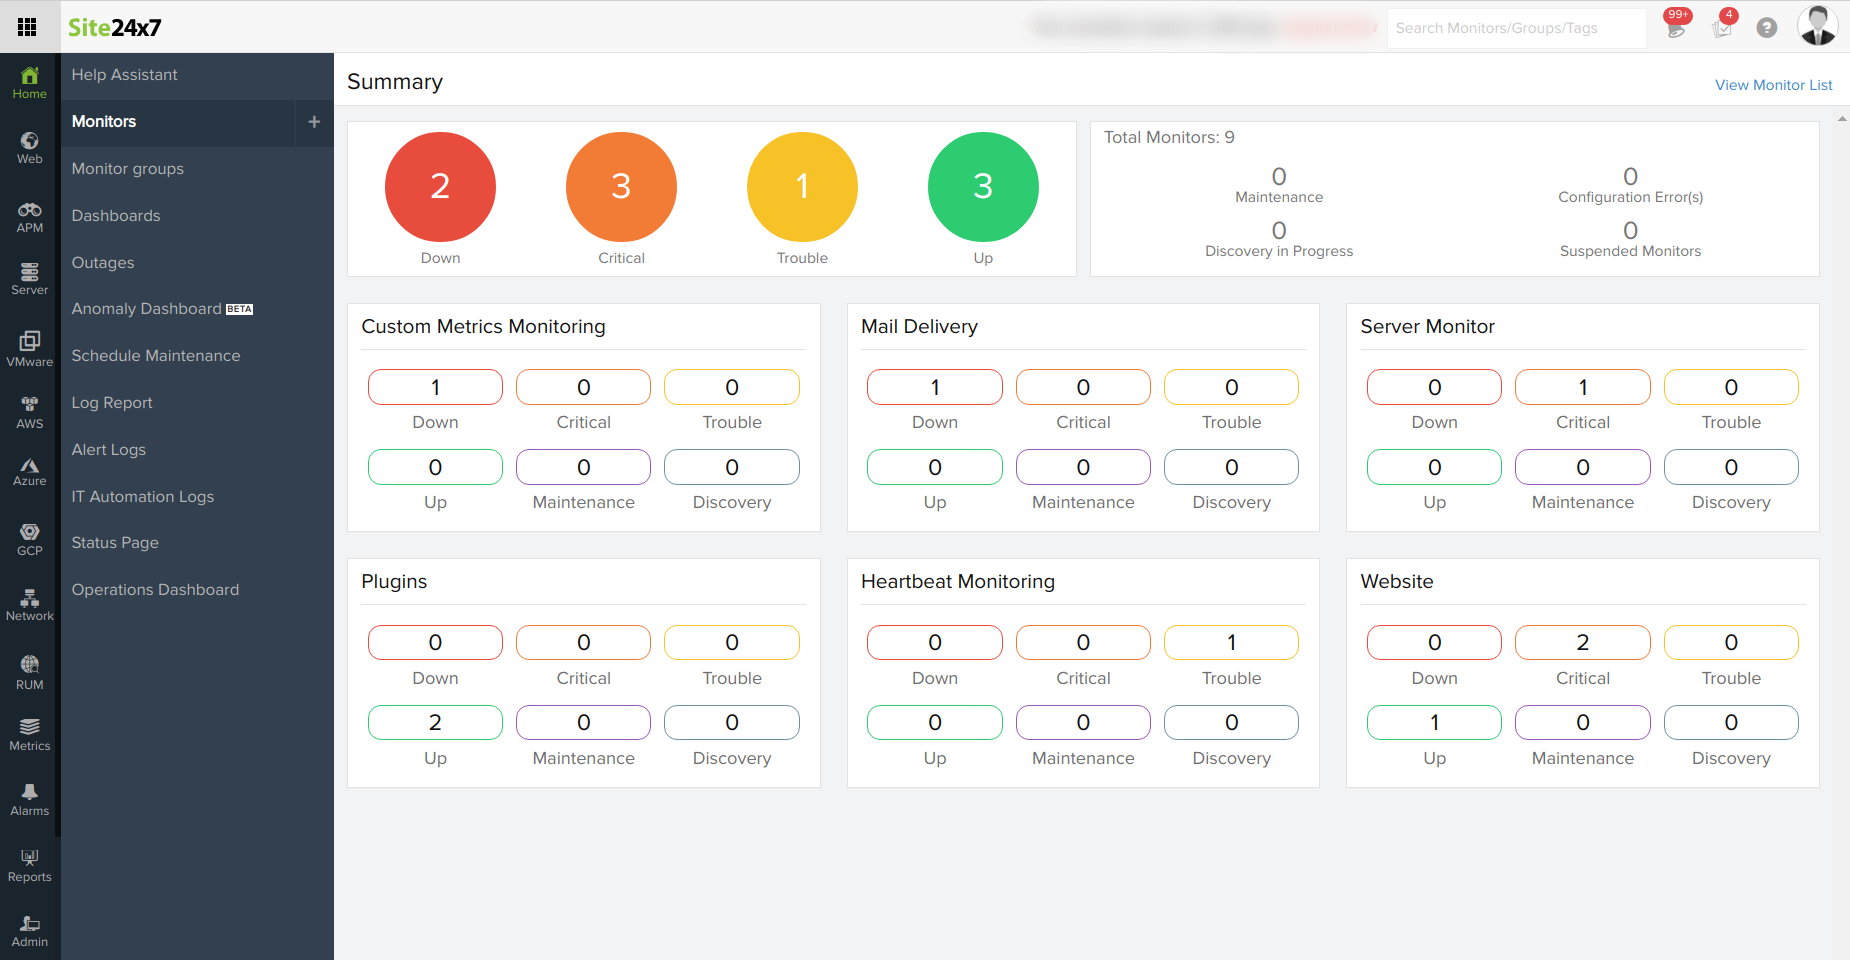
Monitor Status
All monitors will now be smartly categorized into various segments according to their current operational status and state, right in your home screen to give you a better understanding of your monitor's performance. Down monitors are grouped in red. Critical monitors are shown in orange. Trouble monitors are grouped under yellow. Monitors that are under maintenance are grouped under purple. All available monitors are shown in green. It also showcases the monitor count in each of this category. You can also view the number of operational monitors and alert credits remaining in your account. By clicking the "+ Buy More" button, you can purchase additional monitors and alert credits. Further, each configured monitor's response time (in ms) along with its last polling time is also listed in this report.

Monitor Groups View
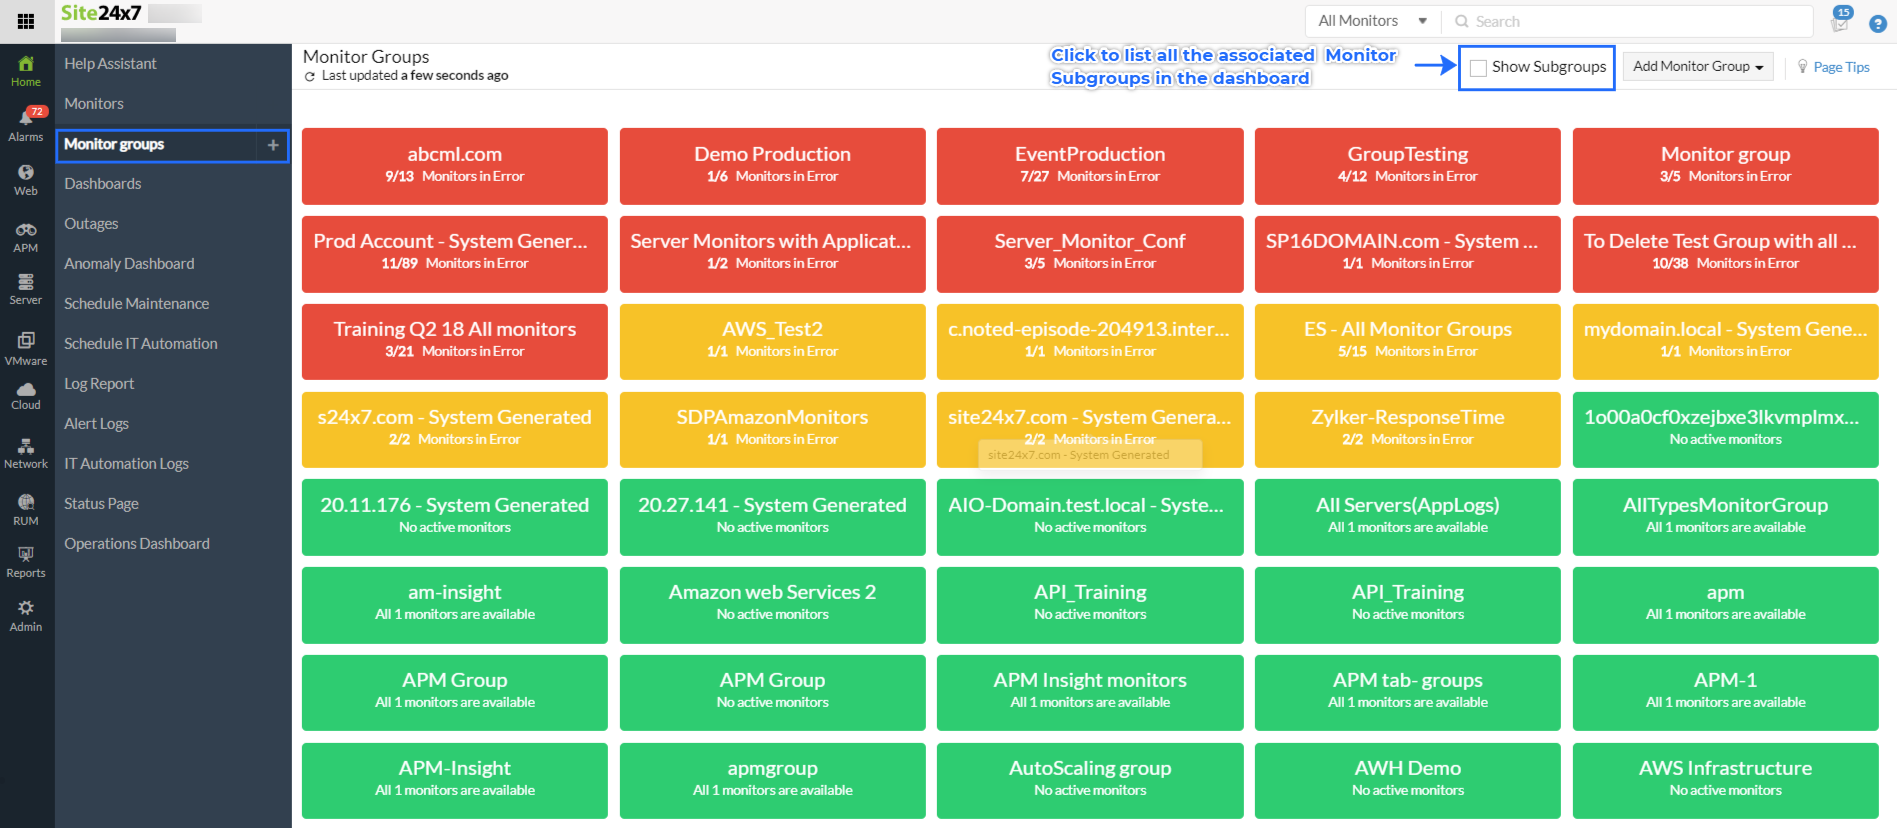
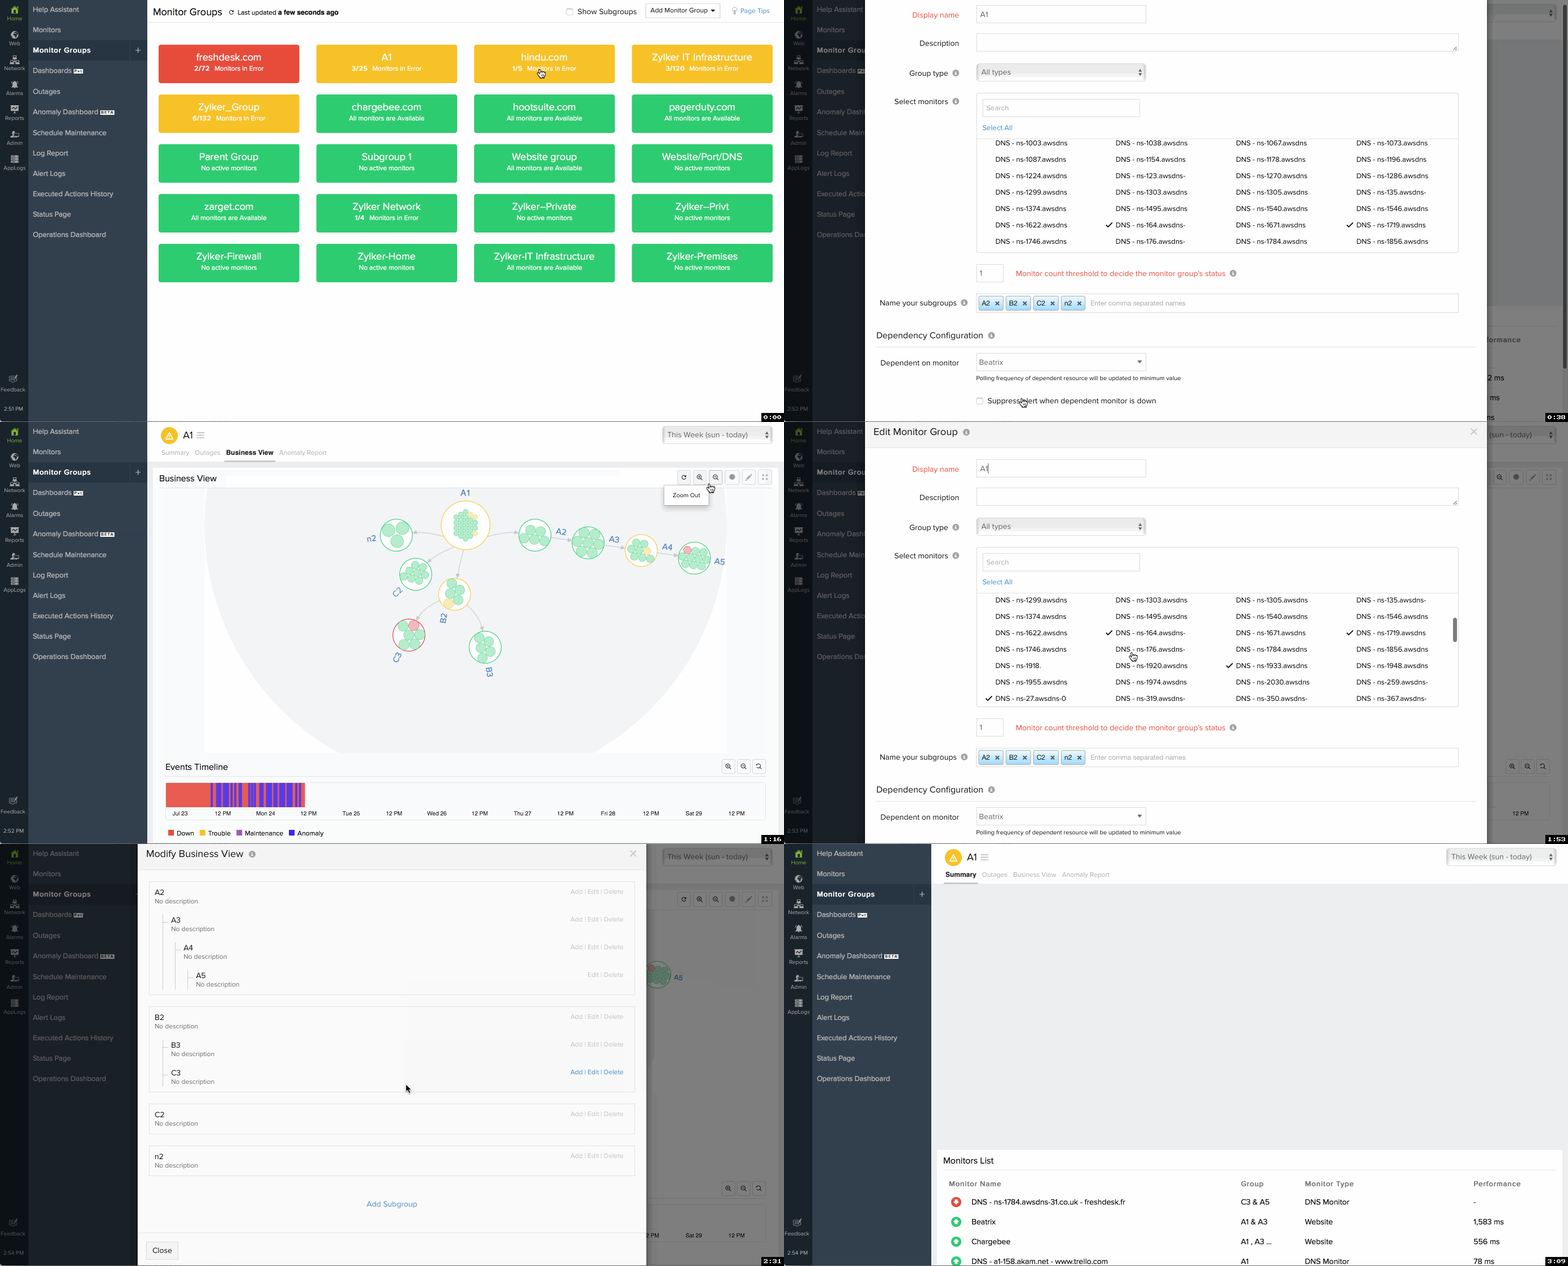
Monitor Groups help you organize resources (Monitors) based on business applications, geography, type or resource ownership, or any other category that would make administering your resources easy. By grouping monitors you can gain insights into metrics like availability and performance of the monitor group for a selected period of time.
-
Business View for Monitor Groups
Based on your Monitor Group and its Subgroup construction, an inbuilt business view lets you obtain a bird's eye view into your infrastructure performance and availability of individual monitors for various time ranges. It helps you to quickly isolate performance outliers in the various groups and subgroups.
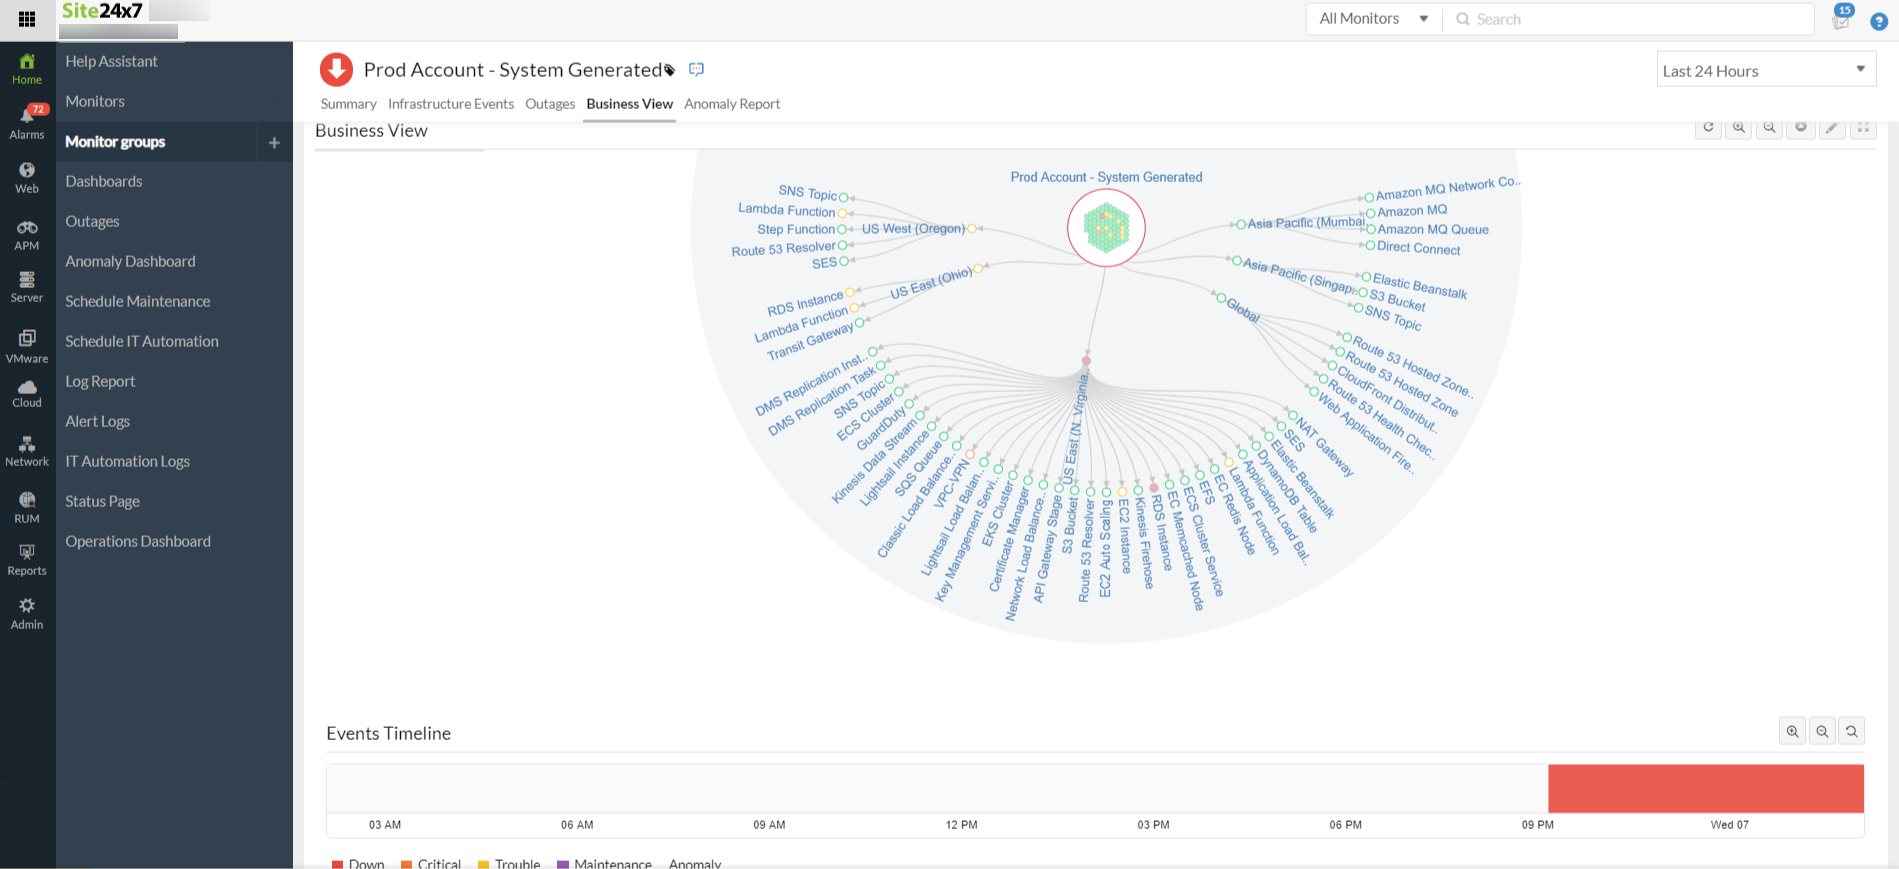
-
Anomaly Detection
Anomaly for the monitor groups allows you to view the anomalies in the group. It detects and lists all the performance deviations for monitors with Performance reports and can help in efficient tracking. Read more about anomaly detection in Site24x7.
-
Outages
The outages tab lists all the outages that happened for the particular group. This is grouped by each monitor outage. You can filter the outages based on the time period for analyzing.
Alert Notifications Badge
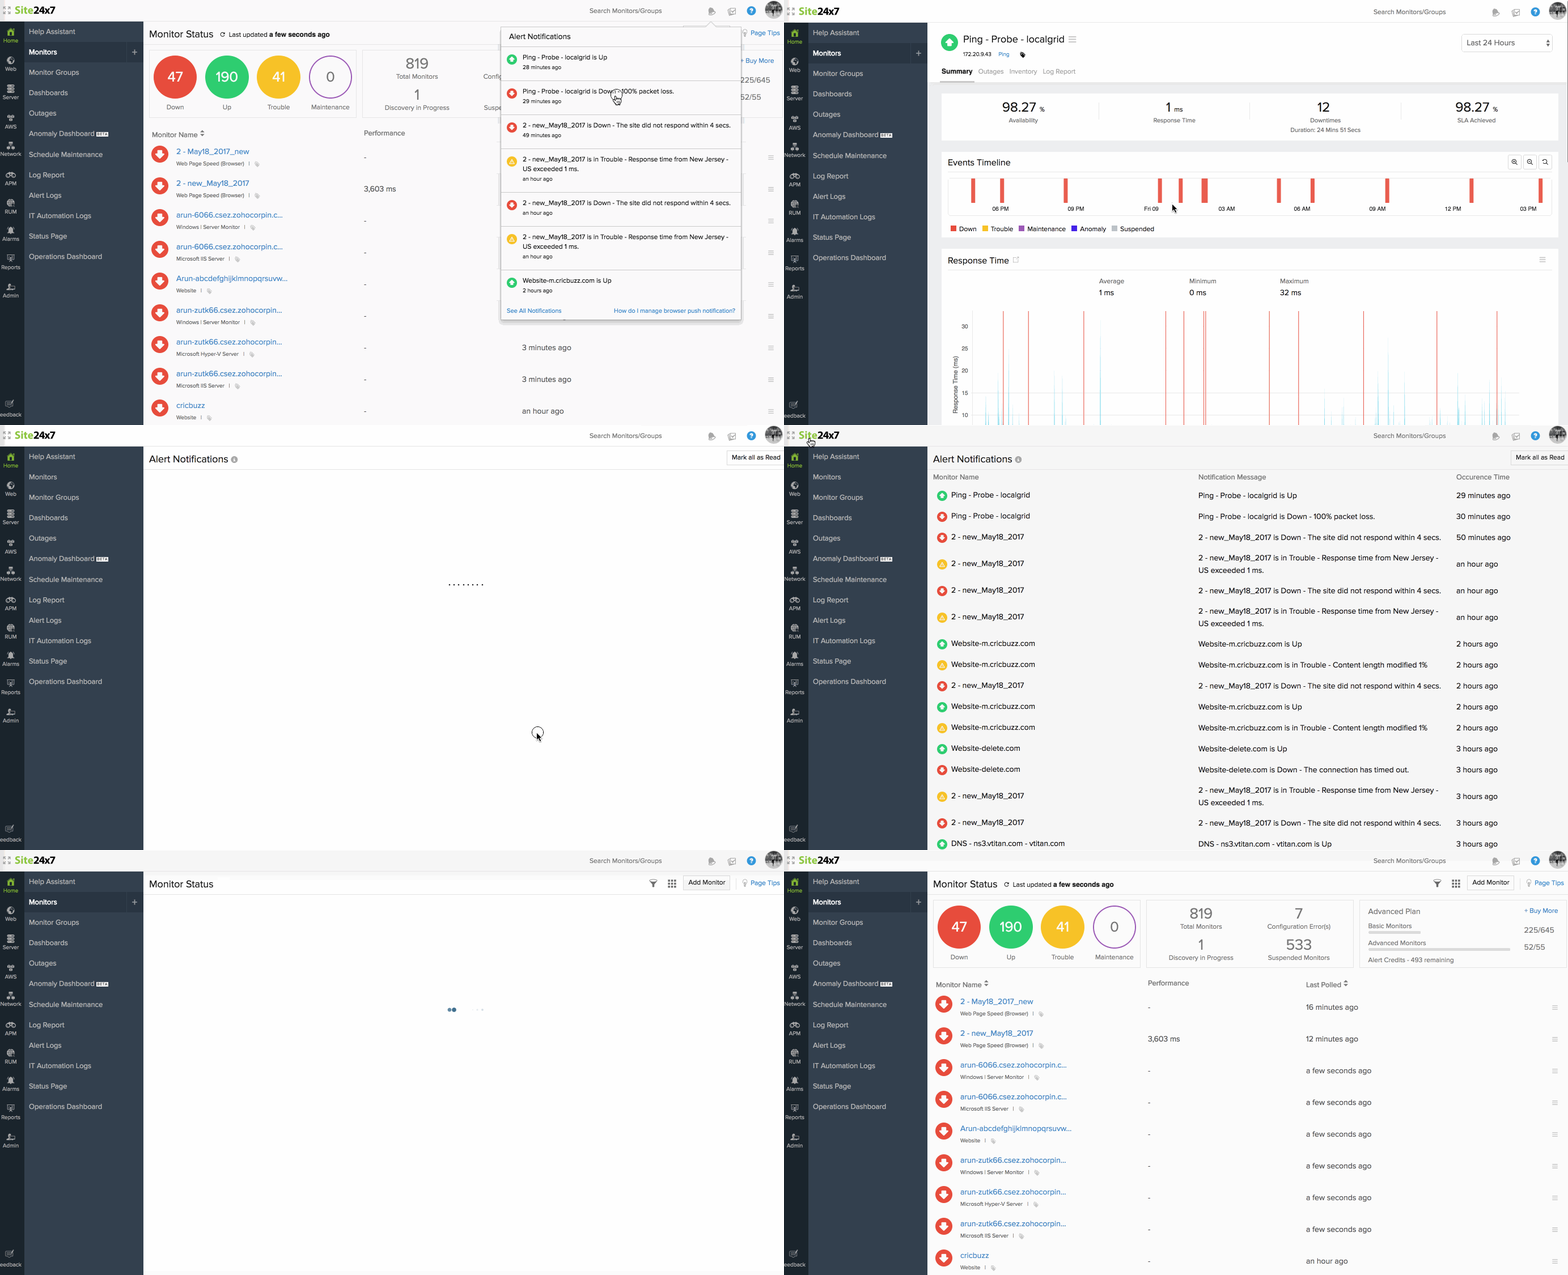
The Alert Notifications badge on the top right corner of the client dashboard lets you instantly view all the status updates in real-time via WMS Notifications. It ensures that you don't miss any critical updates on your monitors, even when you're on a static window. Once you attend a specific notification listed here, you'll be redirected to the Monitor Details page of that monitor. If you want to view all the past 100 notifications, you must click the See All Notifications link. Once you've read all the notifications listed here, you can press the Mark All as Read button. Users can additionally configure Browser Push Notifications for their respective web browsers.
Who gets notified?
Your configured monitors are usually associated with User Alert Groups. User contacts, who are associated to these Alert Groups will receive status notifications from these monitors. Even when the contacts in the User Alert Group doesn't have sufficient privilege to view the monitor status, notifications will still be sent to these user alert contacts. Also, if in case a particular user contact isn't associated to a specific User Alert Group, but has permission to view the monitor, the contact will still be able to view alert notifications via the client.
Let's take an example to explain this case:
Let's say your User Alert Contact is having an "Admin" role with "All monitors" permission in your Site24x7 account. Also, there is an User Alert Group called "Operator Group", which has all the operators listed in it. The contact with the Admin Role isn't associated with the Operator Group. If a monitor named "Zylker - Website", which is associated to the Operator Group, has a status change, all Operators in this Alert Group will be promptly notified. In addition to this, the User Contact with the "Admin" role will also receive the alert notification.
Dashboard Refresh - Clearing Cache
You can refresh your Site24x7 dashboards by clicking the  icon. Additionally, your Site24x7 Monitor dashboard will be refreshed automatically every 5 minutes, by default. Site24x7's status API calls will fetch this data and store it for 5 minutes, by default. The cached data is automatically cleared every 5 minutes. The caching is handled for the following tabs, viz., Home, Web, Server, Network.
How does the caching work?
Caching is always handled for a specific monitor type. Imagine that you've accessed the "Web" tab in the Site24x7 control panel. Here, you navigate to the Website Tab. When you access this tab, an API call will be made and the data will be persisted for the next 5 minutes. Now, let's say you access the Ping Monitor Tab, it'll trigger another API call for the Monitor type Ping and this data will be retained for 5 minutes. Now, if you try switching back to the Website Monitor again within 5 minutes, the data will be served from the existing cache data. However, if this action is performed after 5 minutes, an all new API call will be triggered to fetch the data.
When will the cache be cleared?
- Cache will be cleared every 5 minutes from the time an API call is made.
- If a "WMS Alert Notification" pops in, the existing cache will be dropped and the next time you visit the page, a new API call will be made.
- If the
 icon in the Monitor list page is clicked forcefully, the existing cache will be cleared and a new API call will be triggered.
Caching in Reports
Site24x7 reports support caching of selected headers during an API call. Say you’re generating a summary report for your website monitor with the time period selection as “Today” and unit of time as “RAW”. An API call will be initiated with the selected report headers. Now if you choose "Business Hours" for the same report, another API call will be triggered along with the above settings and business hours id. If you unselect the business hours selection, no API call will be initiated and the cached data will be reused for report creation. It must be noted that caching in reports will persist as long as you move out of the reports tab. That said report settings will be cached even while switching back and forth between reports of different monitors. The cache will be maintained and API calls will be avoided if you’d set the headers and generated a report previously.
Customize Control Panel Dock
You can modify the first level dock icons on your Site24x7 Control Panel. Use the edit button to specify the icons that need to be shown/hidden from the dock. (Check the image below.)
Network Operations Center (NOC) Control Panel for Network Teams
Switch between your existing Home-Monitors listing view and a brand new icon view for a customized NOC Control Panel. View real-time status of all your monitors in your account inside a single dashboard without scroll.
Individual monitors are depicted in a square tile view, with unique color codes being used to depict their real-time monitor status. With NOC view, you can fit in upto 10K monitors in a single screen. Additionally, for DOWN, CRITICAL, TROUBLE or CONFIGURATION ERROR monitors, the reason is also shown. On clicking a relevant tile, you can drill down to view the monitor details. Alter the theme of the NOC View by picking a darker theme. All allowed monitors will be visible in the NOC view, however, if the user is not an alert contact for these monitors, the status would not be updated in real time. Since the NOC view is handled by cookie, you will always view the recent NOC screen with their active filters. (Check the image below.)
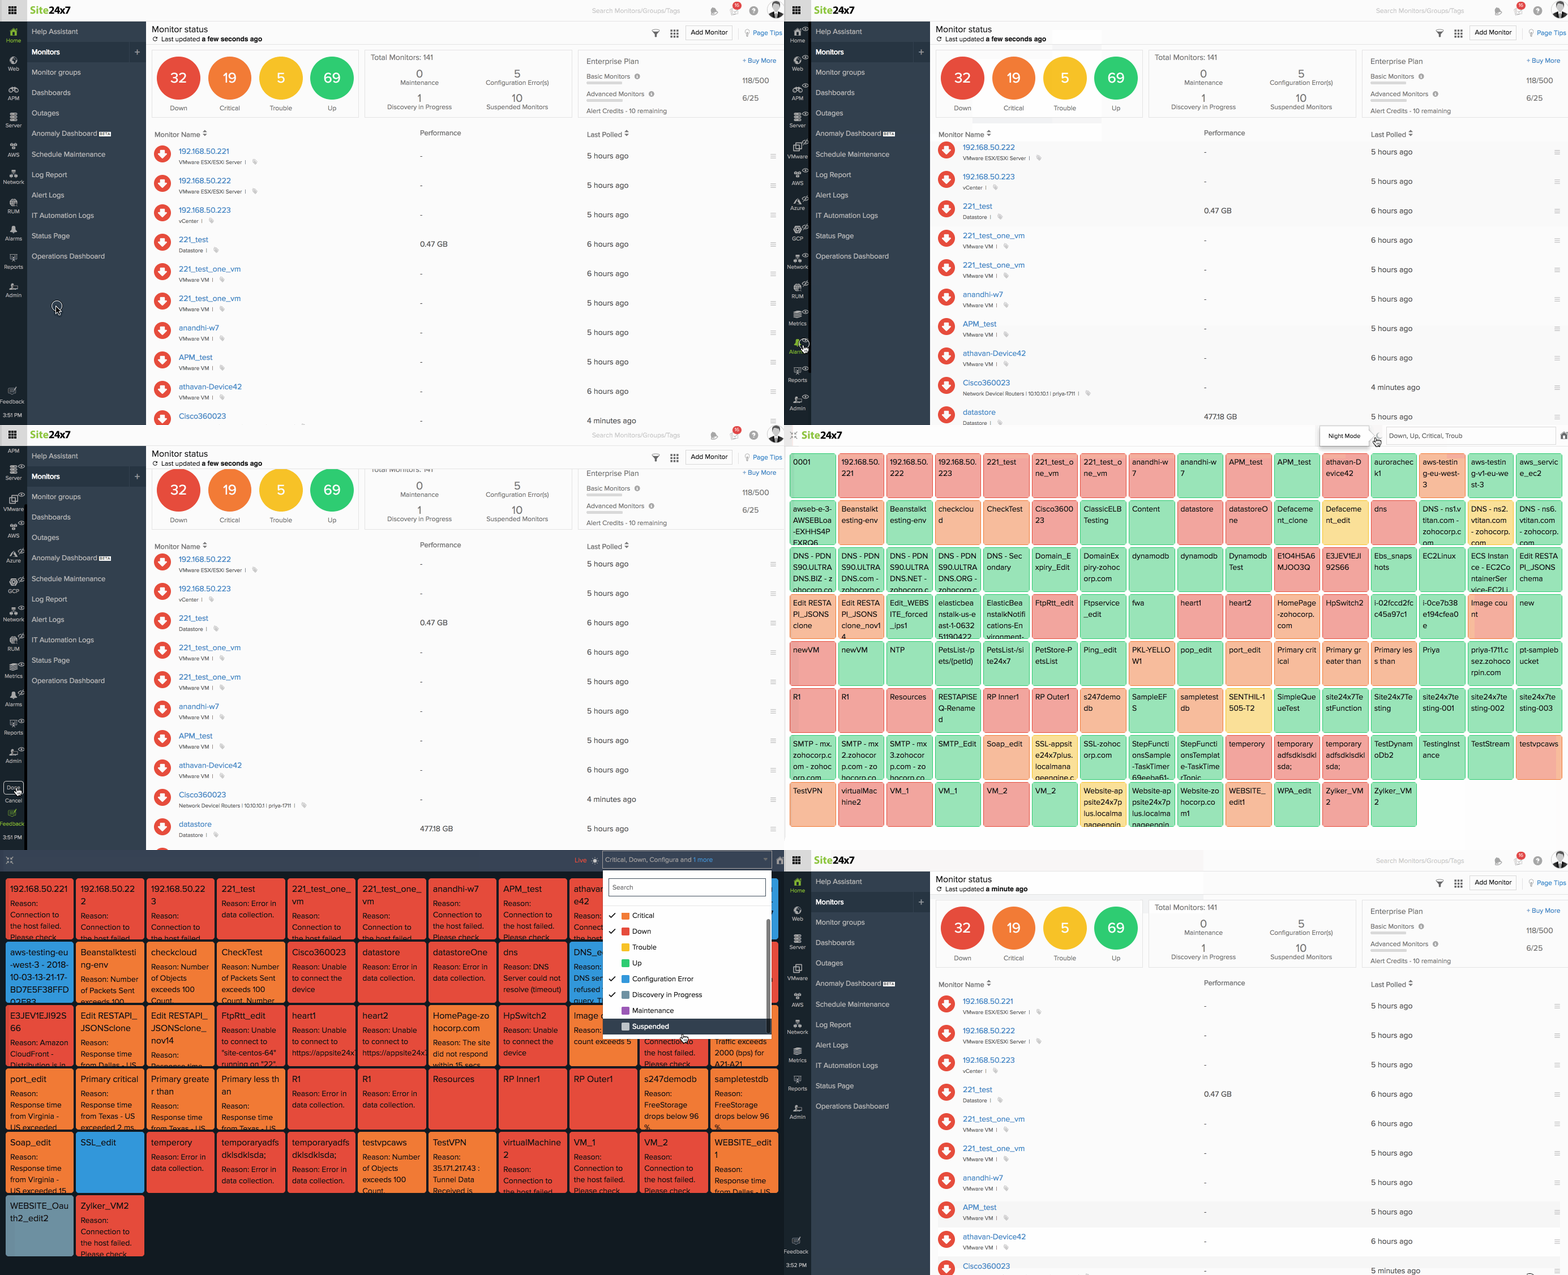
Fig: Edit Dock in Control Panel and NOC Control Panel
Markdown Syntax
Markdown is an easy to use language used to format your text. Site24x7 allows the usage of Markdown syntax while adding Monitor inventory notes. Tell me more about Markdown syntax.

 in the Notifications Badge. However, once you mark the notifications badge
  as read, the favicon turns