Site24x7 AppLogs for Log Management
AppLogs is a Site24x7 log management service that helps you upload and manage your logs across all your infrastructure―all on a single dashboard.
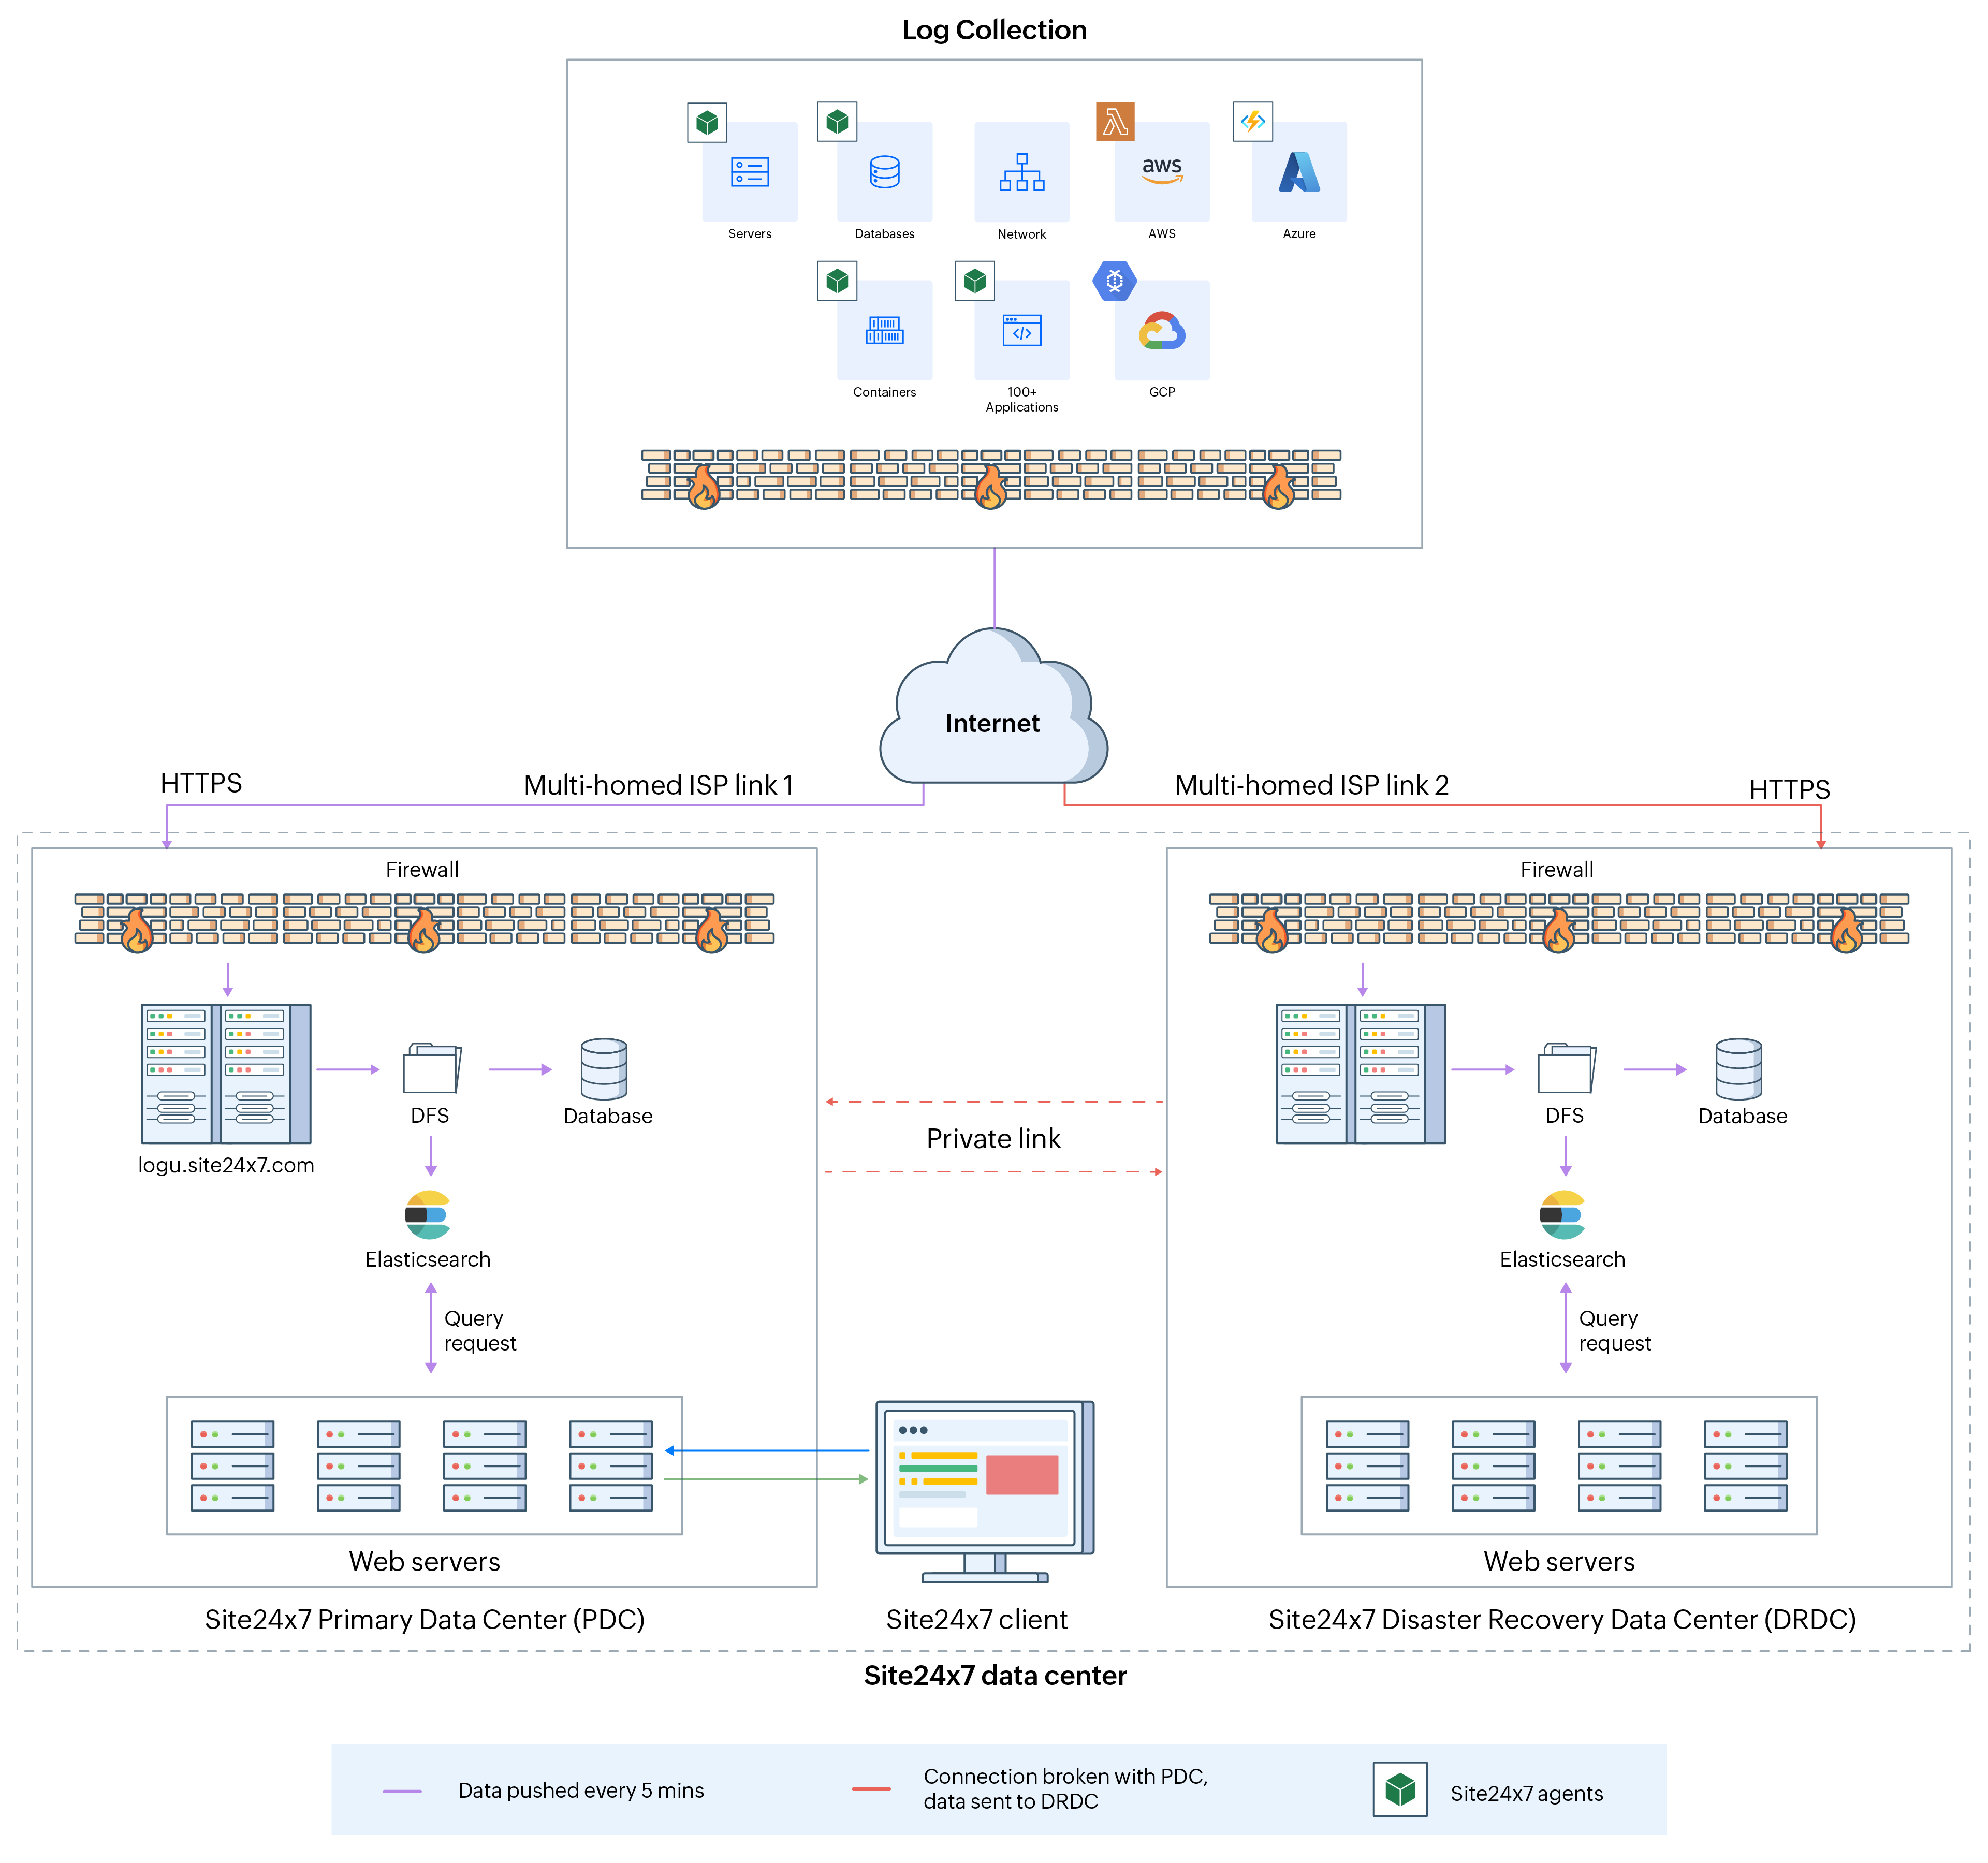
AppLogs works with the existing Server Monitoring Agent (Windows | Linux) and supports more than 100 different log types by default. It also provides support for cloud logs from Azure, AWS, and GCP, and allows logs to be sent via an API endpoint. For more information, refer to the various log ingestion methods here. A log type defines the format in which an application writes logs. If a log type is not supported out of the box, you can create a custom log type. Once the logs are collected, they will be available for a query-language-based search. You can configure log-based alerts to notify you of any issues in advance.
Quick Start Guide for Log Management
- Install Site24x7 Server Monitoring Agent (Windows | Linux)
- Create a Log Type or choose it from over 100 different log types
- Associate it to the Log Profile
- Perform a query-language based search on your logs
- Create a log-based alert
 How-to videos
Create and associate a log type with a log profile | Search your logs using the query language in AppLogs | Use AppLogs search and its features
Here is a video that demonstrates how AppLogs works:
What is AppLogs?
Site24x7 AppLogs is an agent-based log collection and management tool based in the cloud. In addition, it also supports cloud logs such as Azure, AWS, and GCP and sending logs via an API endpoint. Using AppLogs, you can collect, combine, index, analyze, and manage logs from various servers, applications, and log frameworks.

Why AppLogs?
-
Spend more time cracking errors and less time tracking them
AppLogs makes log monitoring simple, agile, and effective by including everything on a single intuitive interface. It is integrated with Site24x7 Server Monitoring, which helps you identify the causes of server outages quickly. All your logs across servers, applications, routers, containers, and more are listed in one central location. This saves you the hassle of individually tracking down logs from multiple servers, helping you resolve outages faster. -
Key insights are now a click away
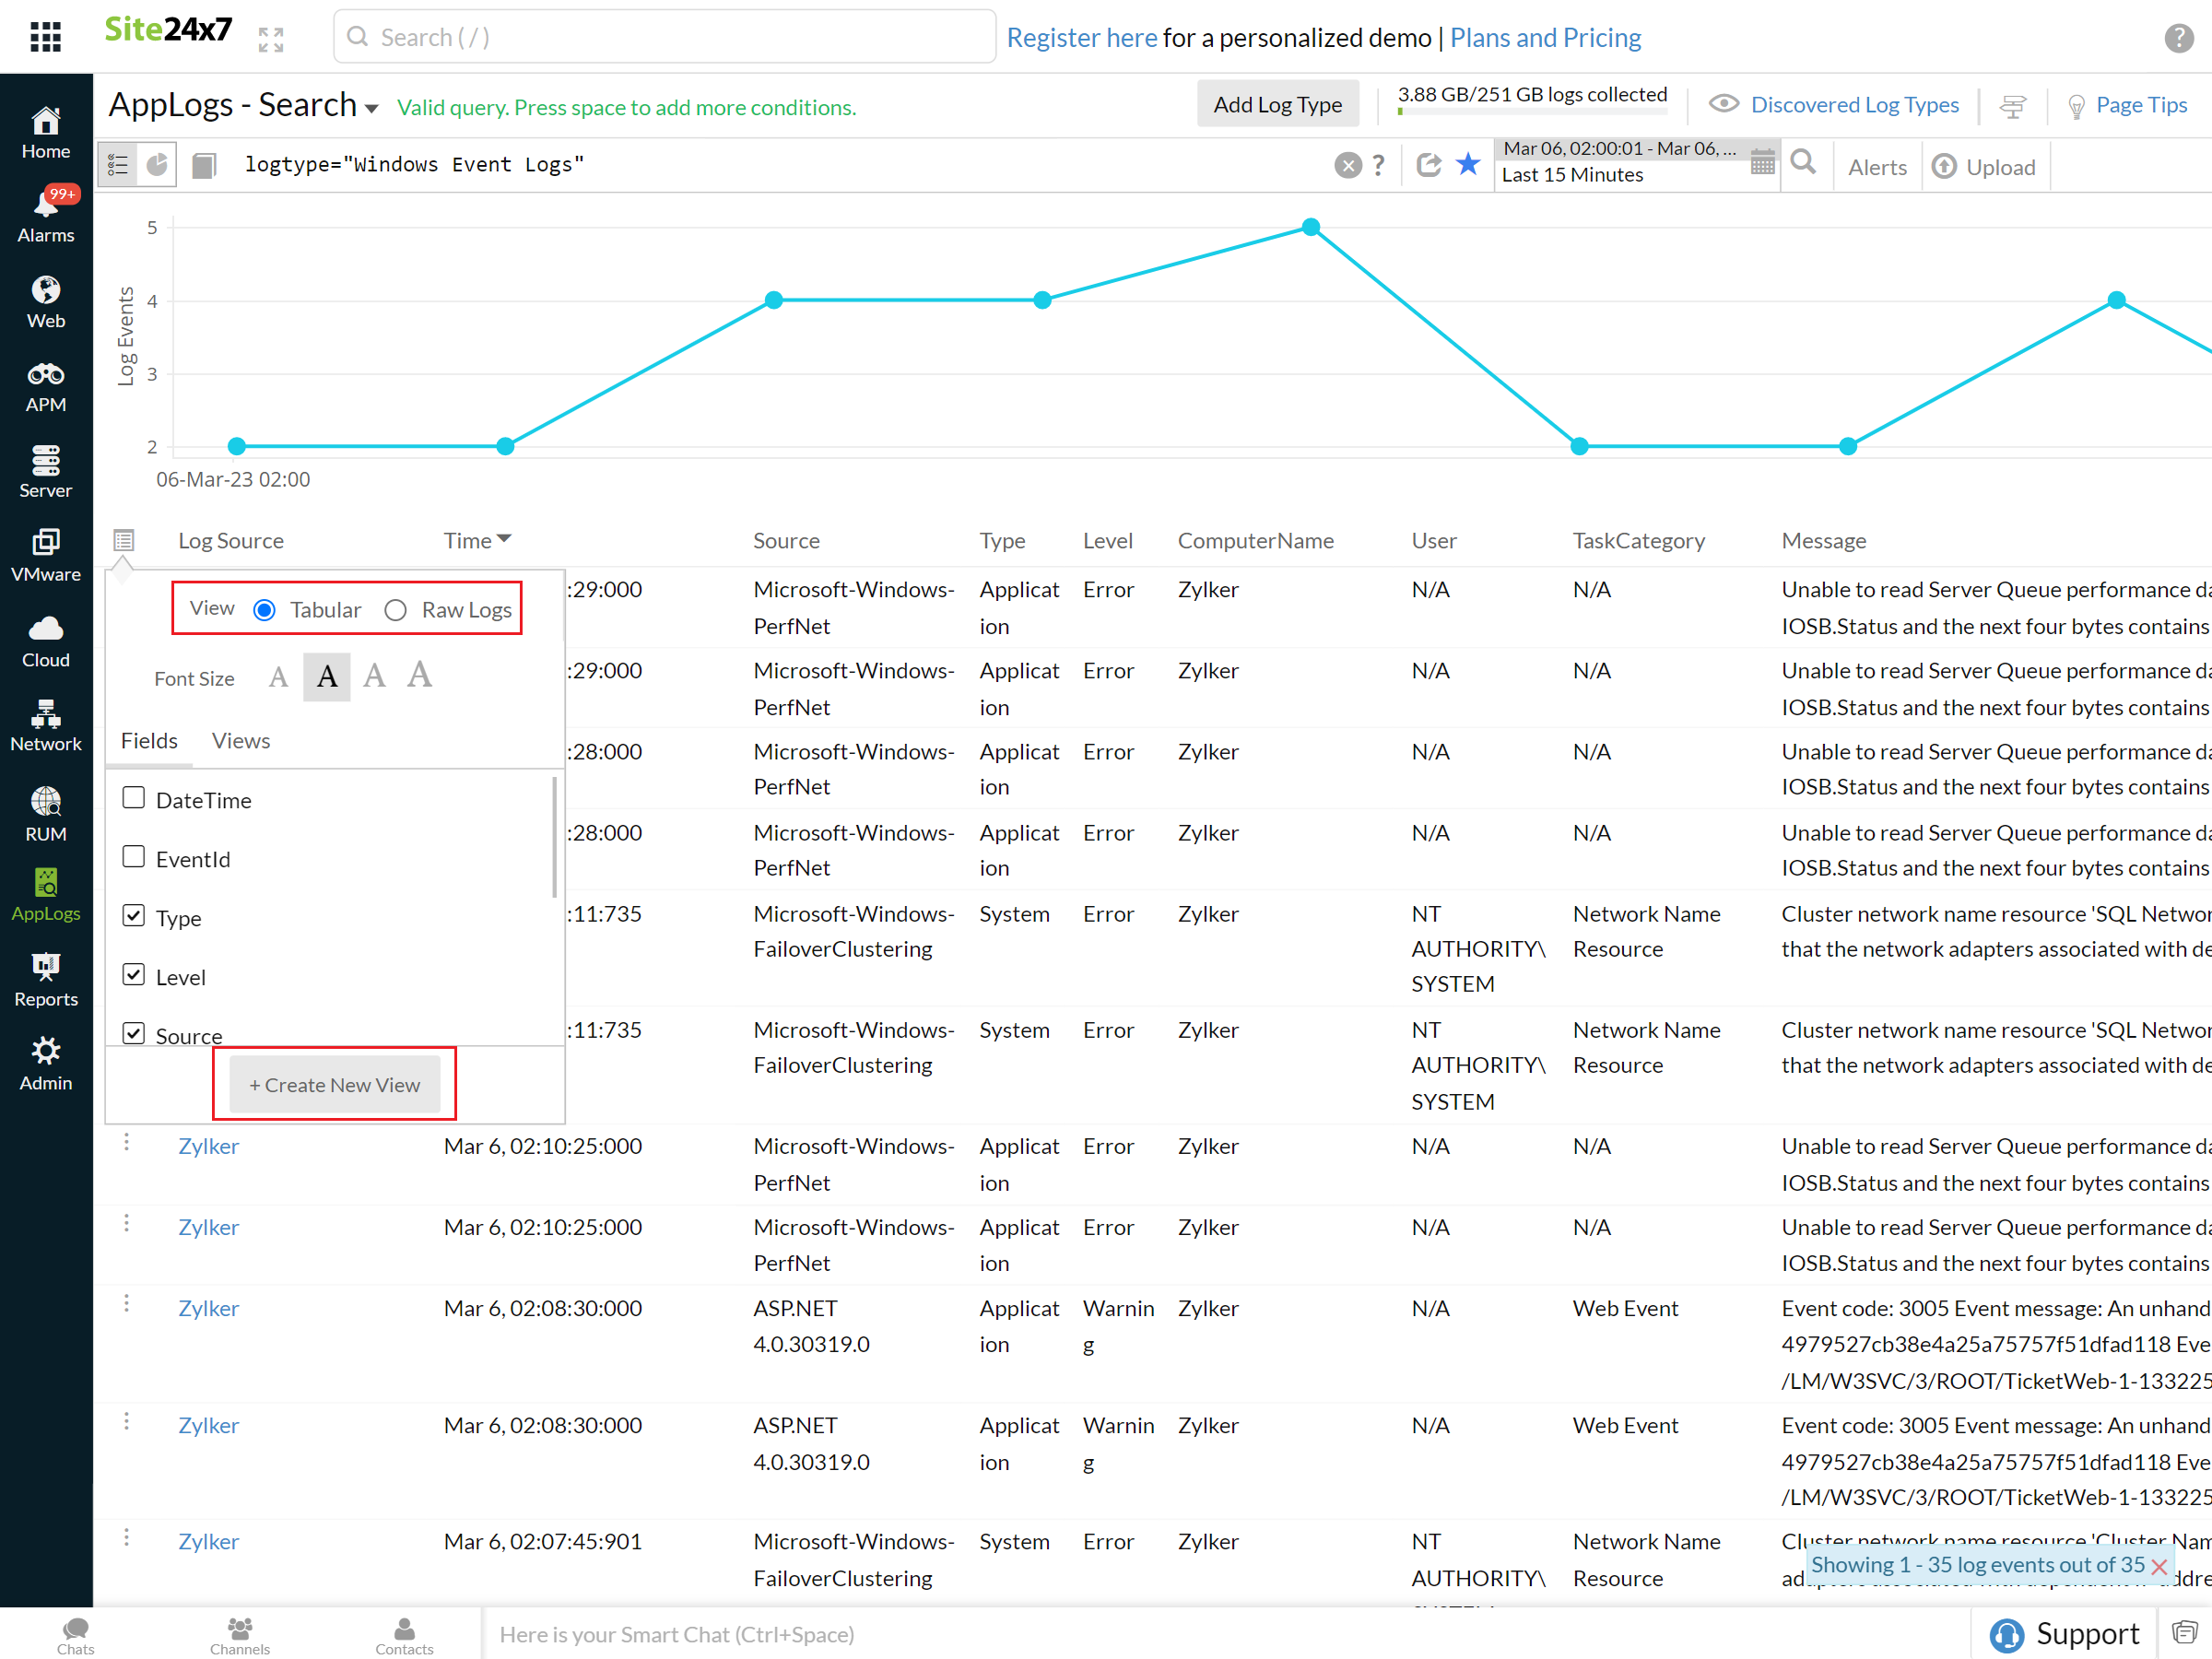
One of the major common issues in log monitoring is too much data being displayed on a cluttered screen. With AppLogs, you can view logs in a tabular view or raw view, enabling thorough interpretations so that you can spot that needle in the haystack with just the click of a mouse button.

-
Unmatched speed, for all your needs
With AppLogs, you will be able to search logs across all your servers at an unmatched speed, allowing you to spend more time uncovering insights. -
Log retention period
Site24x7 provides multiple log retention periods (7, 15, 30, 60, and 90 days).
How does it work?
Once the Site24x7 Server Monitoring agent is successfully updated, it starts communicating with Site24x7 and pushes logs from your server to ours. Then your logs are indexed for faster search and stored for archival and retrieval.
You will need to upgrade the Site24x7 Server Monitoring Agent to version 18.4.0 and above for Windows or 16.6.0 and above for Linux to use AppLogs.
What is a log type?
A log type is a clear definition of the format in which an application writes logs. Different applications (such as IIS, Cassandra, Apache, and MySQL) write logs in different formats. Thus, defining them as log types helps you group logs from different applications to enable easy access and efficient searching. You can also upload your logs collected via log shippers, like Fluentd and Logstash, and track them using AppLogs.
Supported log types
Site24x7 supports over 100 log types, including IIS logs, Apache logs, syslog, Windows event logs, Salesforce logs, Kubernetes audit logs, Elasticsearch slow logs, and Redis logs. Cloud logs from Azure, AWS, and GCP are also supported.
Once the Site24x7 Server Monitoring agent is updated and you have given permission to start monitoring, all your logs that already belong to these supported log types will be retrieved. You can now start managing your logs by performing search queries.
Custom log types
If your log types are not on the list of supported log types, you can create custom log types to meet your requirements. Take an instance of your environment running multiple microservices that are writing logs in different formats. You can define them by creating custom log types.
Default log discovery
By default, Site24x7 discovers supported log types that are available on your servers. You can simply select and add them for monitoring. Once you define a custom log type, those logs will also be discovered by default

What is a log profile?
A log profile enables you to associate log types with a particular set of servers. Once a log profile is created, corresponding logs will automatically be pushed to your account. A log profile will be created automatically if your logs match one of our default supported log formats because they will be automatically discovered. Otherwise, you can create a new log profile to associate your custom log types.
Re-index logs
Site24x7 has a maximum retention period of 90 days, meaning old log data gets deleted after this period. Re-indexing helps you access older logs if you have longer retention enabled for your account.
Scheduled reports
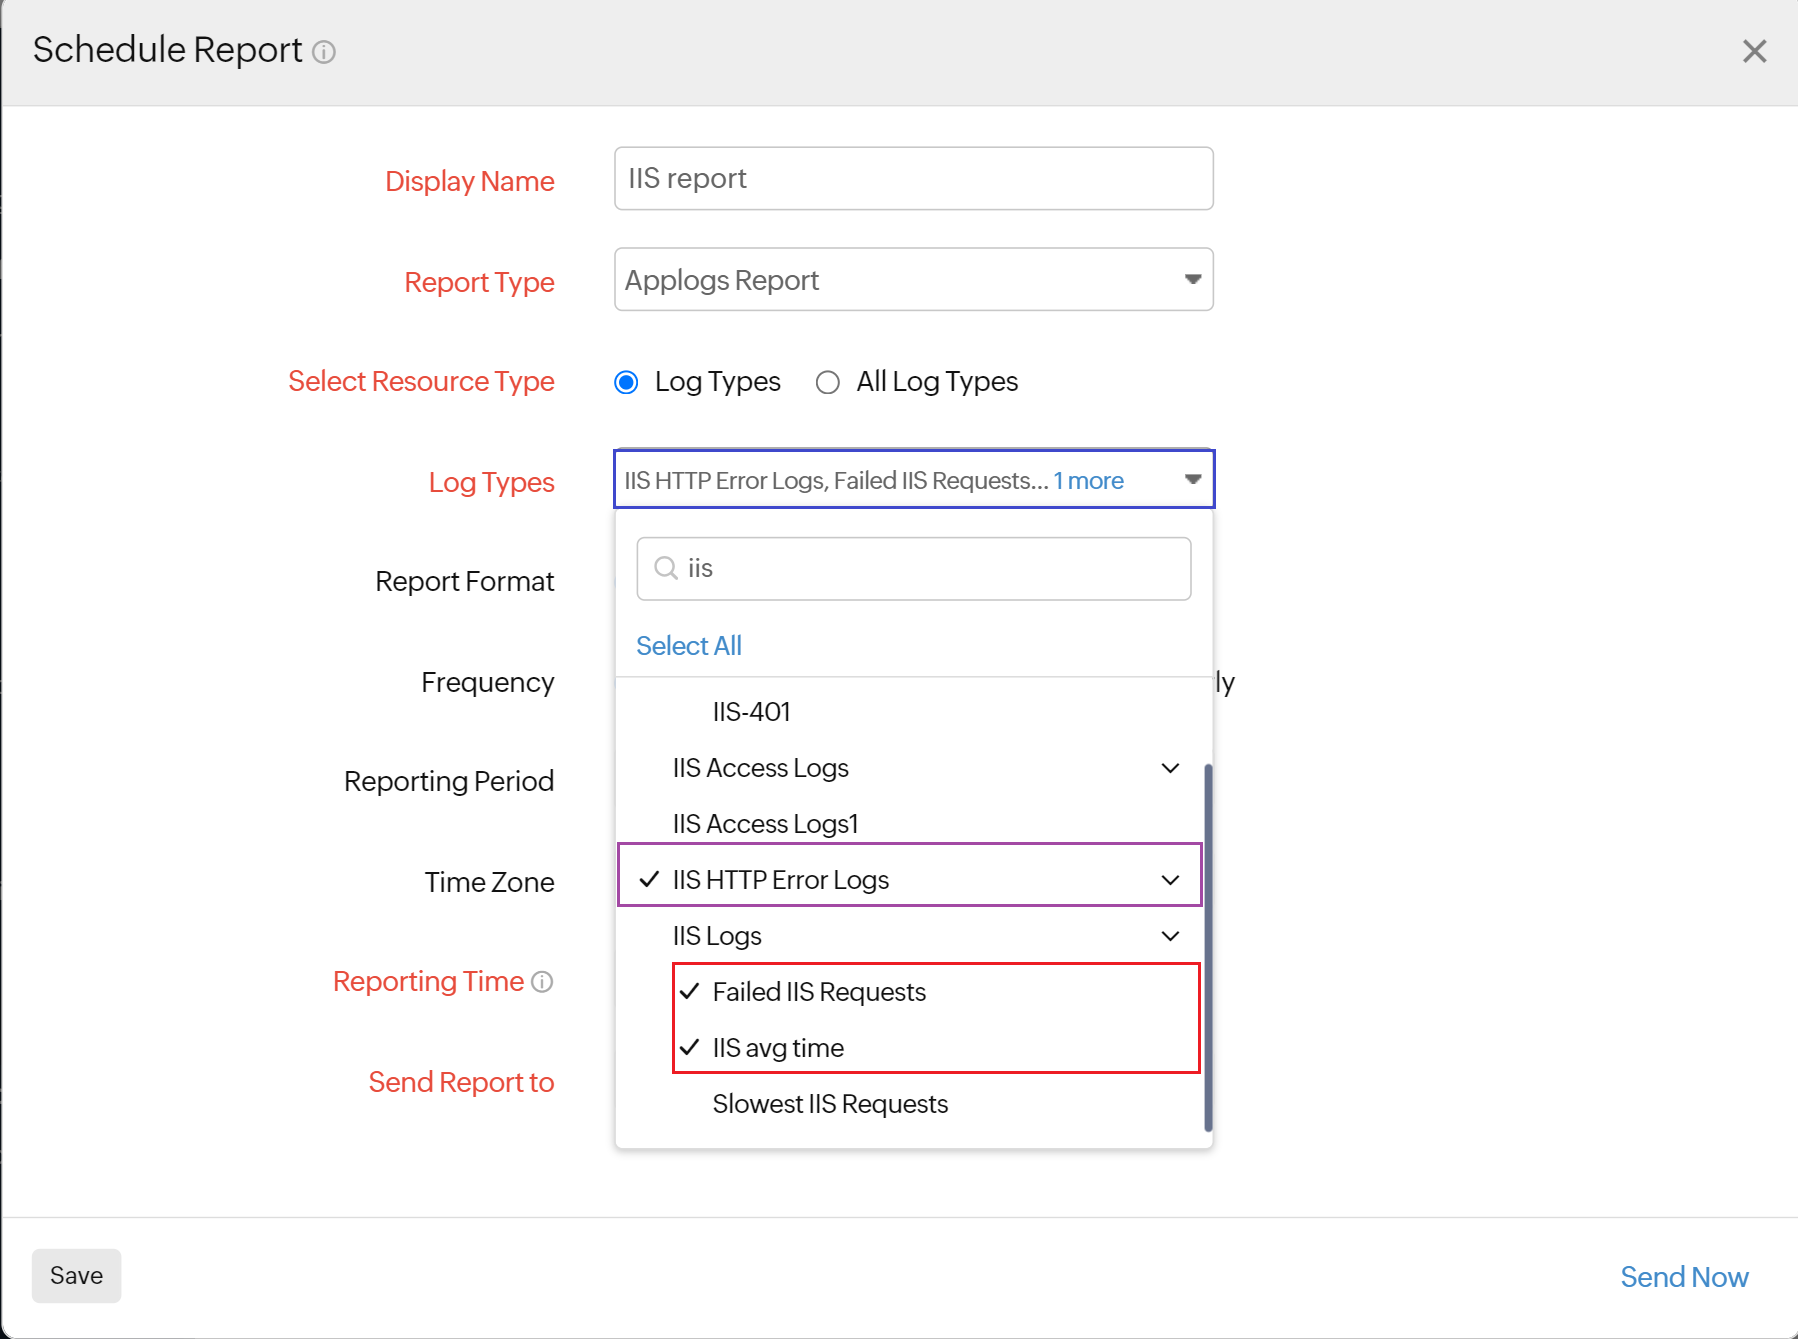
You can schedule reports for your log types and saved searches. AppLogs' scheduled reports give you detailed insights into all your default log type widgets and saved searches for the log types you choose. You can also choose to view the scheduled reports for all of your log types. In addition to a comprehensive log-based report, you can also choose a specific saved search query to obtain the results in a report format.

Query language and other search options
To search your logs efficiently, navigate to AppLogs from the left pane. You can filter the logs using various options listed below:
- Use our easy-to-understand query language search to filter out errors and obtain actionable results quickly. Refer to this documentation to learn more about query syntax, structure, and types.
- Search your logs easily by providing a relative time period (in days, hours, or minutes) in the date picker.
- Use the Exclude Time Period option to avoid viewing the logs during your maintenance period.
- Use Log Type View to build custom views for focusing on the relevant debugging information.
Handling large log Data in searches
Log entries exceeding 64KB will be displayed as clickable links when searching logs with large data instead of loading the full content immediately. This enhancement reduces loading times and improves the user experience, especially for large log entries (e.g., 1MB).
As a result:
- Log entries over 64KB will appear as clickable links rather than displaying the full content.
- Search functionality remains unaffected, and you can continue to use the query language as usual.
- No data is truncated; click the link to view the complete log entry.
AppLogs dashboard
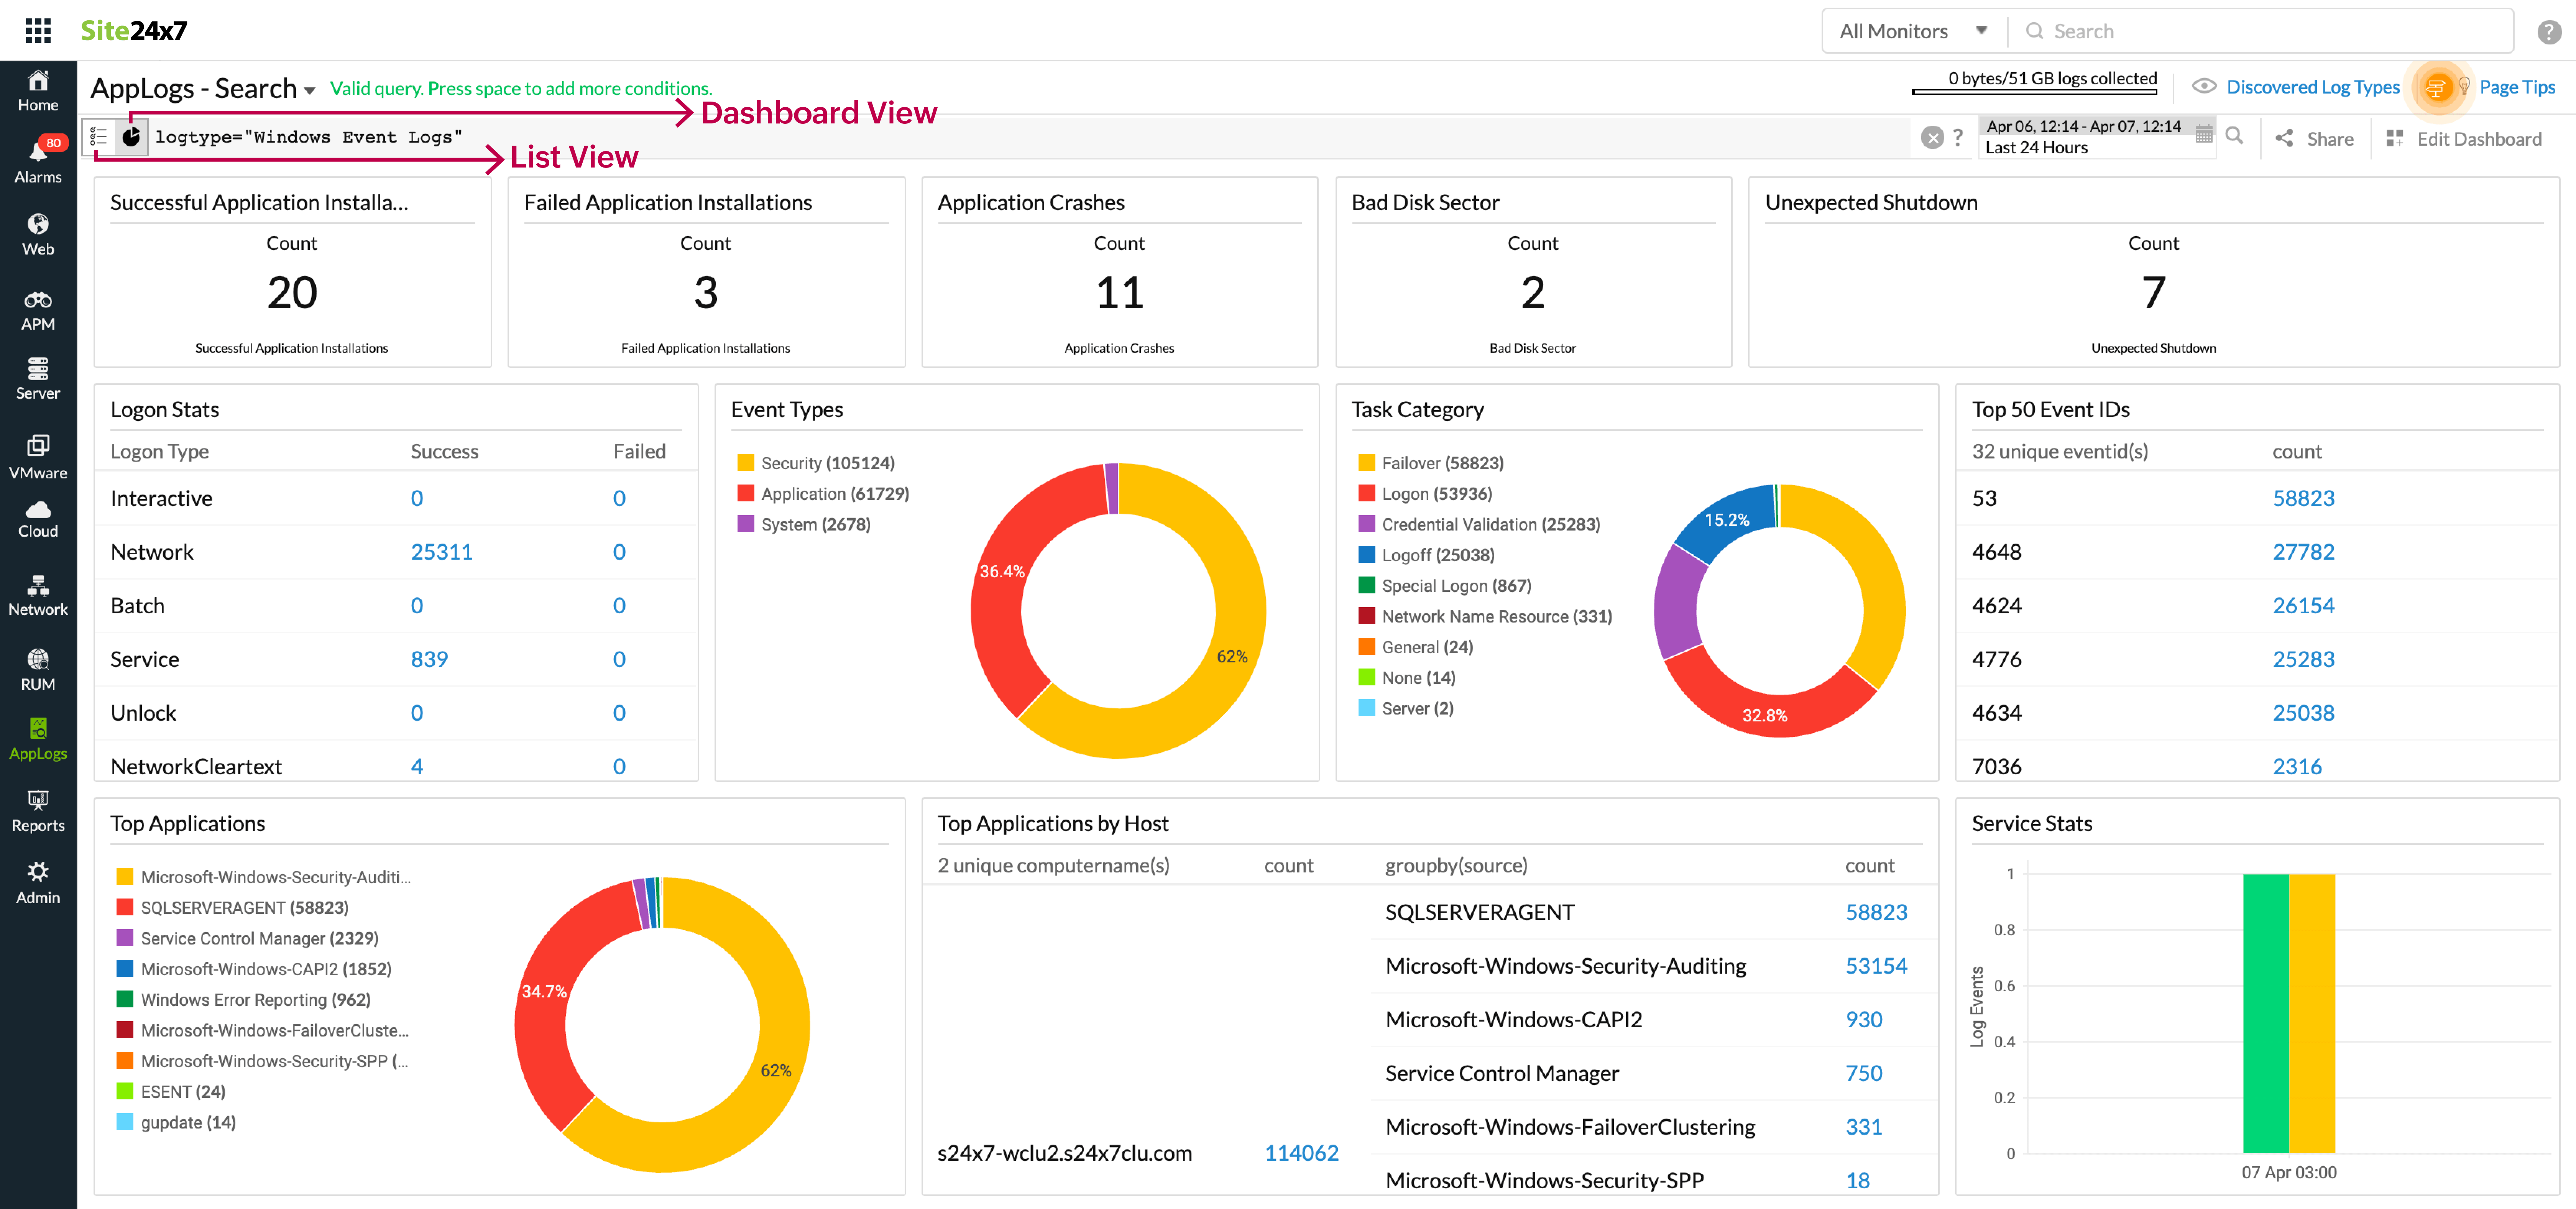
You can view your logs via two different approaches:
- Click the List View icon to view your log results as rows and columns.
- Click the Dashboard View icon to view the log results as widgets on a dashboard.
With both views, you can simply enter search queries, filter logs based on those queries, and view the logs condition-wise on an intuitive dashboard.
All your saved searches will be added to the default dashboard for every log type. You can also add the saved search widgets to your custom dashboard.

AppLogs usage summary
You can view your daily and overall log consumption, which enables you to assess usage trends, manage your logs efficiently, and plan your add-ons accordingly.
AppLogs alerts
AppLogs alerts allow you to set thresholds and send alerts about critical issues to your predefined user alert groups. You can also associate your monitor with your preconfigured third-party services. Additionally, you can resolve common issues using IT Automation.
