Managing MySQL Slow Query Logs
The MySQL database server can log queries that take longer to execute than the configured threshold in the MySQL slow query logs, meaning these logs help troubleshoot issues related to slow applications easily. In general, one second is considered the threshold for MySQL database queries, and queries that take more than one second for execution are registered as slow.
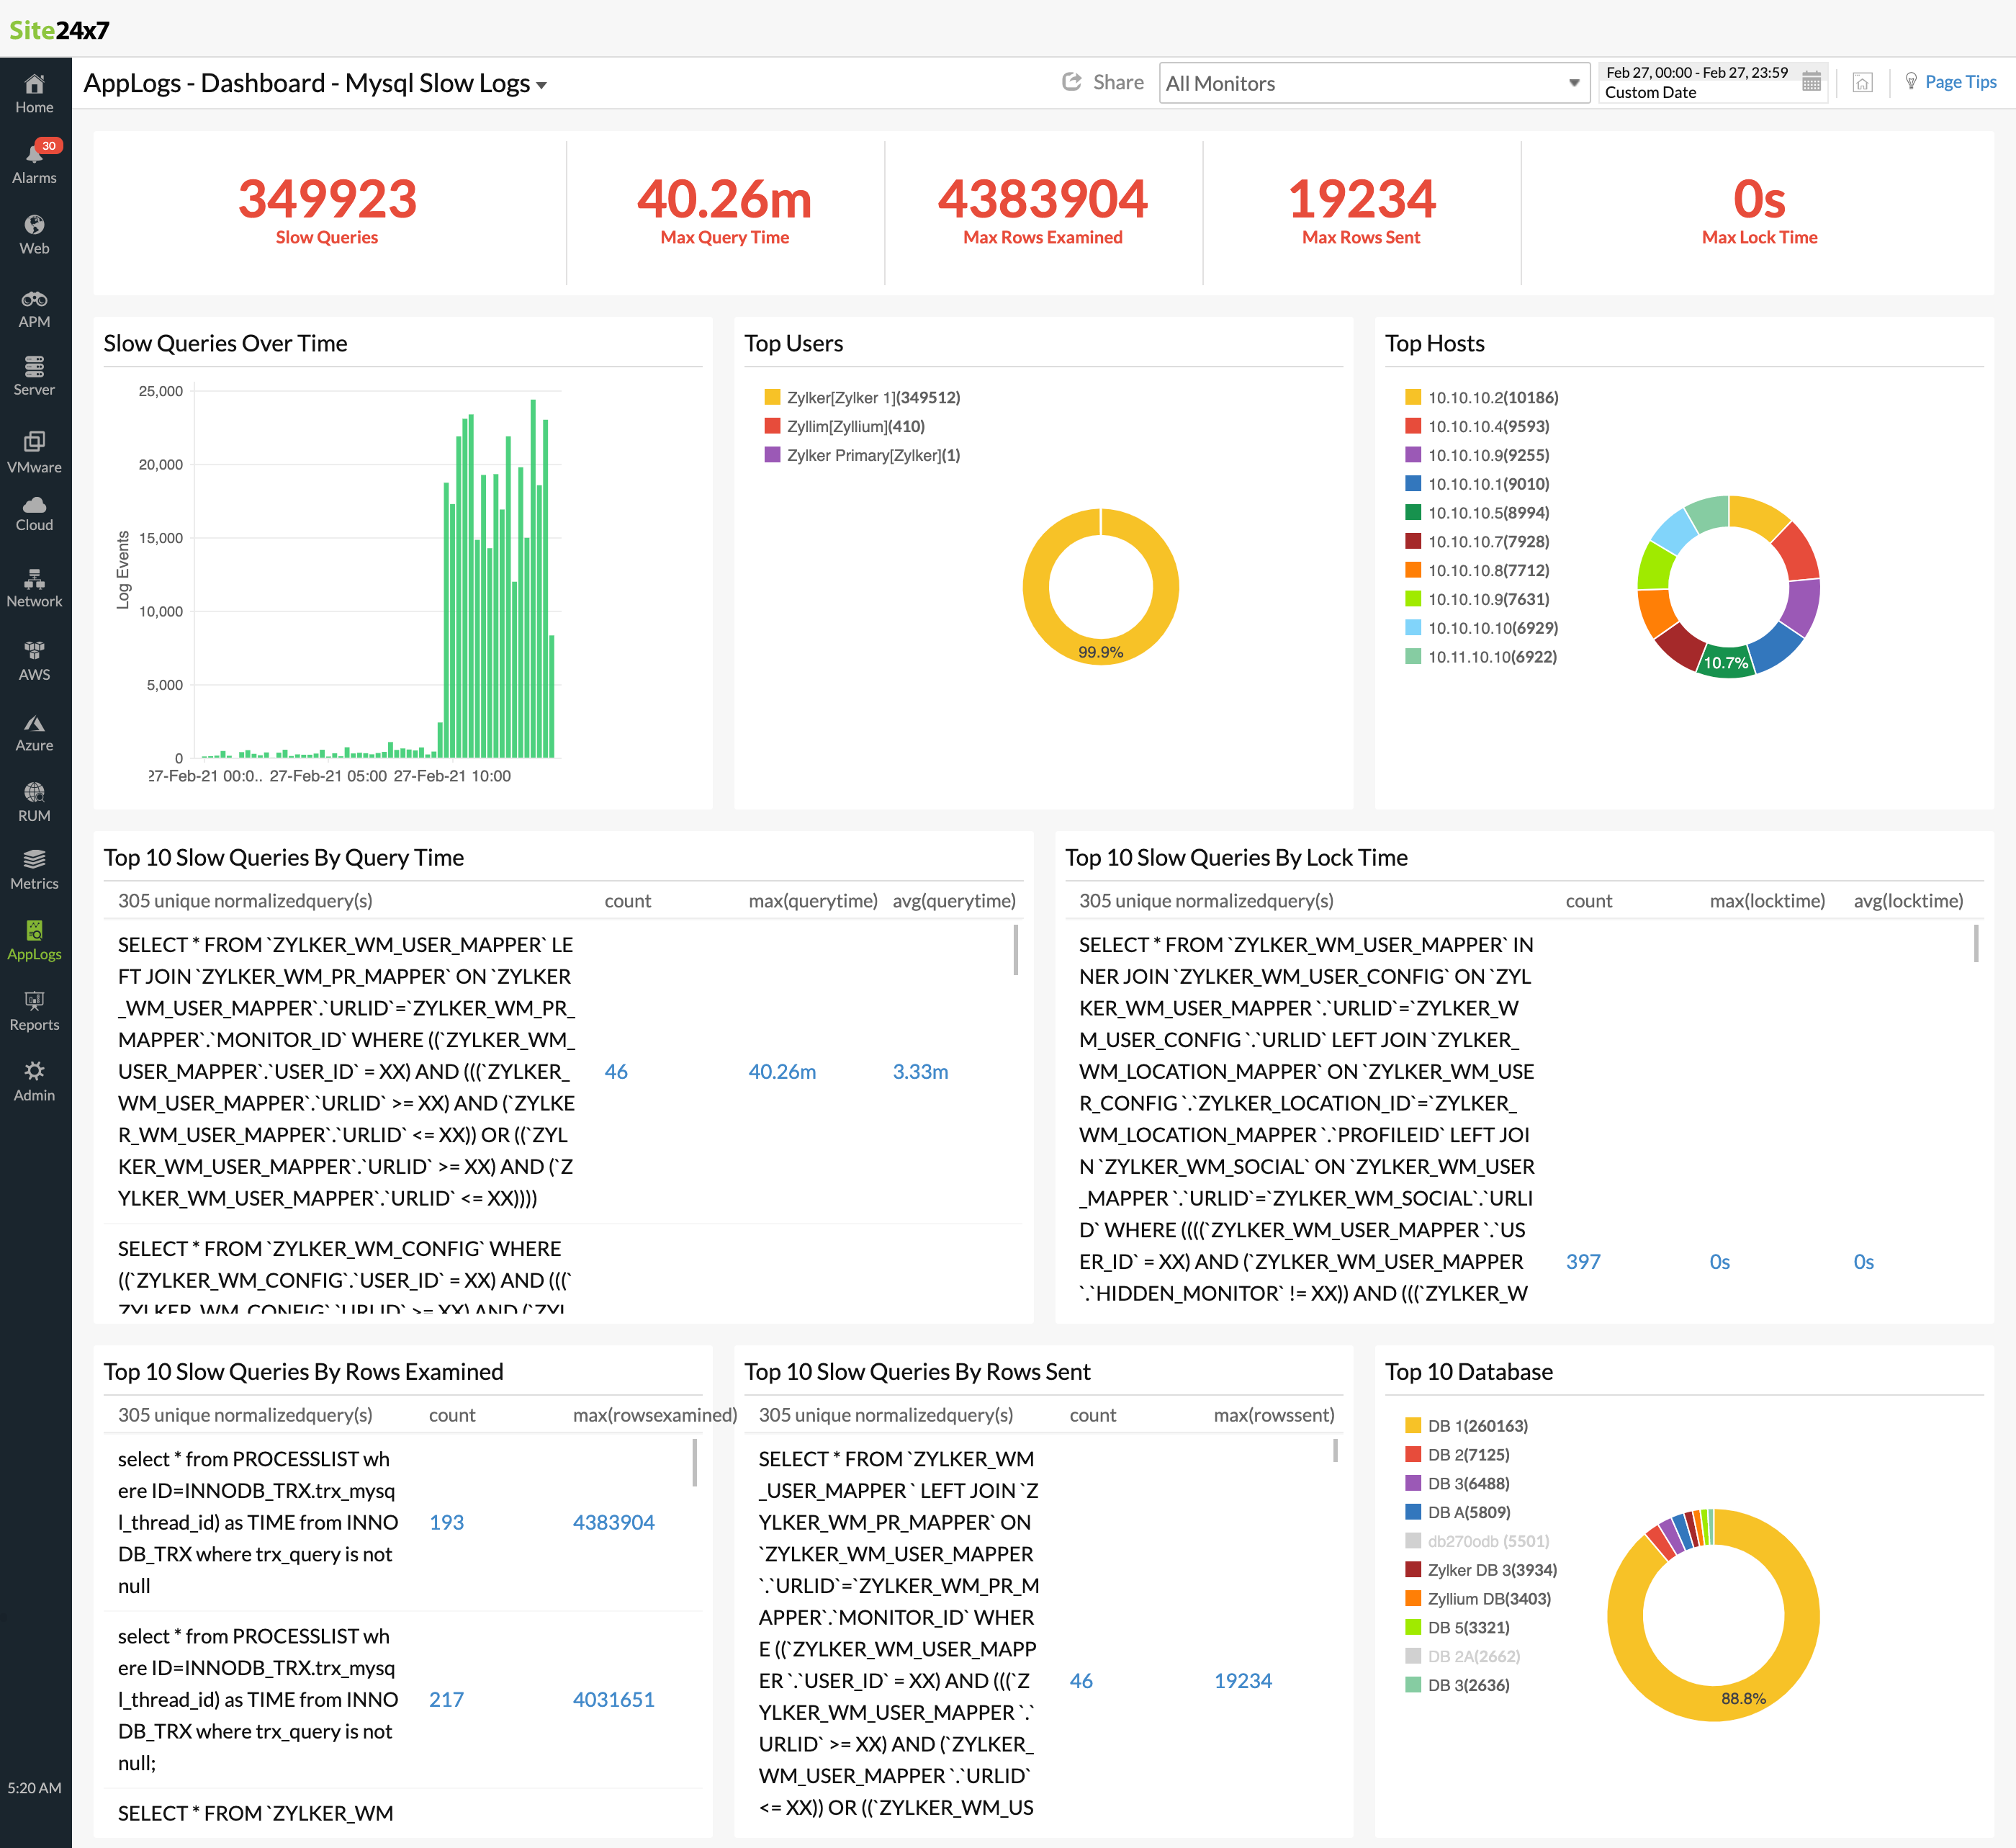
Site24x7's comprehensive log management solution offers support for monitoring MySQL slow query logs by default. It categorizes the logs based on fields including the host, query time, lock time, rows sent, and rows examined so you can troubleshoot at a glance using these logs. You can also view the top 10 slow queries based on different parameters like query time, lock time, rows examined, and rows returned on a dashboard.
Enabling MySQL slow query logs
Log in to the machine in which your MySQL database is installed. Open the Terminal from your Linux machine or the Command Prompt from your Windows machine, and execute the following commands.
For MySQL version 5.1.6 and above:
set global slow_query_log = 'ON';
set global slow_query_log_file ='/var/log/mysql/slow-query.log';
set global long_query_time = 10; (Unit seconds)
FLUSH LOGS;
Restart MySQL.
For MySQL versions below 5.1.6:
Edit the /etc/my.cnf file, and add the following lines to the [mysqld] section.
You can edit the file directly from the Terminal using the vi command.
log-slow-queries=/var/log/mysql/slow-query.log
long_query_time=20
Getting started with log management
- Log in to your Site24x7 account.
- Download and install the Site24x7 Server Monitoring agent (Windows | Linux) on the machine in which the MySQL database is running.
- Go to Admin > AppLogs > Log Profile, and click Add Log Profile.
- Profile Name: Enter a name for your Log Profile.
- Choose the Log Type: Choose MySQL slow logs from the drop-down menu.
- Log Source: Choose Local File from the drop-down menu.
- List of files to search for logs: Include /var/log/mysql/slow-query.log. This is based on the configuration in MySQL.
- Select the server, and click Save.
Log pattern
# User@Host: $User$ @ [$Host$]<NewLine># Query_time: $QueryTime:decimal$ Lock_time: $LockTime:decimal$ Rows_sent: $RowsSent:number$ Rows_examined: $RowsExamined:number$<NewLine>!use $Database$;<NewLine>!SET timestamp=$DateTime:date:unix$;<NewLine>$Query$;!<NewLine>$NormalizedQuery:word$!
This is the default pattern defined by Site24x7 for parsing MySQL slow query logs based on the sample mentioned below.
There are two fields separate fields called Query and NormalizedQuery in the log type definition.
Here, the Query field will contain the actual raw query while the NormalizedQuery field will have the query with masked (XX) condition values.
By default, the Query field will be ignored on the agent side as it may contain sensitive information like username and password. You can collect the raw query, by simply changing the toggle button to No next to Ignore this Field at Source in the field configurations.
Sample logs
# User@Host: test[test] @ [192.168.1.2]<NewLine># Query_time: 31.896695 Lock_time: 0.000065 Rows_sent: 1023 Rows_examined: 196182<NewLine>use db100db;<NewLine>SET timestamp=1487758318;<NewLine>select USER_ID, EMAIL_ID from USER_ACCOUNT where USER_ID IN ( select USER_ID from USER_MAPPER where ID IN ( select RESOURCEID from appdetails where environment regexp '(.*)Microsoft Windows NT 5.2|Microsoft Windows NT 5.1|Microsoft Windows NT 5.0|Microsoft Windows NT 6.0(.*)'));
# User@Host: test[test] @ [192.168.1.2]<NewLine># Query_time: 31.896695 Lock_time: 0.000065 Rows_sent: 1000 Rows_examined: 196182<NewLine>use db100db;<NewLine>SET timestamp=1487758318;<NewLine>select USER_ID, EMAIL_ID from USER_ACCOUNT where USER_ID IN ( select USER_ID from USER_MAPPER where ID IN ( select RESOURCEID from appdetails where environment regexp '(.*)Microsoft Windows NT 5.2|Microsoft Windows NT 5.1|Microsoft Windows NT 5.0|Microsoft Windows NT 6.0(.*)'));
# User@Host: test[test] @ [192.168.1.2]<NewLine># Query_time: 31.896695 Lock_time: 0.000065 Rows_sent: 560 Rows_examined: 196182<NewLine>use db100db;<NewLine>SET timestamp=1487758318;<NewLine>select USER_ID, EMAIL_ID from USER_ACCOUNT where USER_ID IN ( select USER_ID from USER_MAPPER where ID IN ( select RESOURCEID from appdetails where environment regexp '(.*)Microsoft Windows NT 5.2|Microsoft Windows NT 5.1|Microsoft Windows NT 5.0|Microsoft Windows NT 6.0(.*)'));
The sample log above can be separated into the following fields, each of which will take its respective value from here and will then be uploaded to Site24x7.
| Field name | Field value |
|---|---|
| User | test[test] |
| Host | 192.168.1.2 |
| Query time | 31.896695 |
| Lock time | 0.000065 |
| Rows sent | 1023 |
| Rows examined | 196182 |
| Database used | 100db |
| Timestamp | 1487758318 |
| Query | select USER_ID, EMAIL_ID from USER_ACCOUNT where USER_ID IN ( select USER_ID from USER_MAPPER where ID IN ( select RESOURCEID from appdetails where environment regexp '(.*)Microsoft Windows NT 5.2 |Microsoft Windows NT 5.1|Microsoft Windows NT 5.0|Microsoft Windows NT 6.0(.*)')) |
MySQL slow query logs dashboard
AppLogs creates an exclusive dashboard for every Log Type, and shows a few widgets by default. Here's a list of the widgets available in the MySQL slow query logs dashboard:
- Slow Queries
- Max Query Time
- Max Rows Examined
- Max Rows Sent
- Top 10 Slow Queries By Lock Time
- Slow Queries Over Time
- Top Users
- Top Hosts
- Top 10 Slow Queries By Query Time
- Top 10 Slow Queries By Lock Time
- Top 10 Slow Queries By Rows Examined
- Top 10 Slow Queries By Rows Sent
- Top 10 Database
In addition to the default widgets, your saved searches will also be added to the dashboard automatically.

