Performance Metrics of Webpage Speed (Browser)
Interpret Webpage Speed (Browser) Results
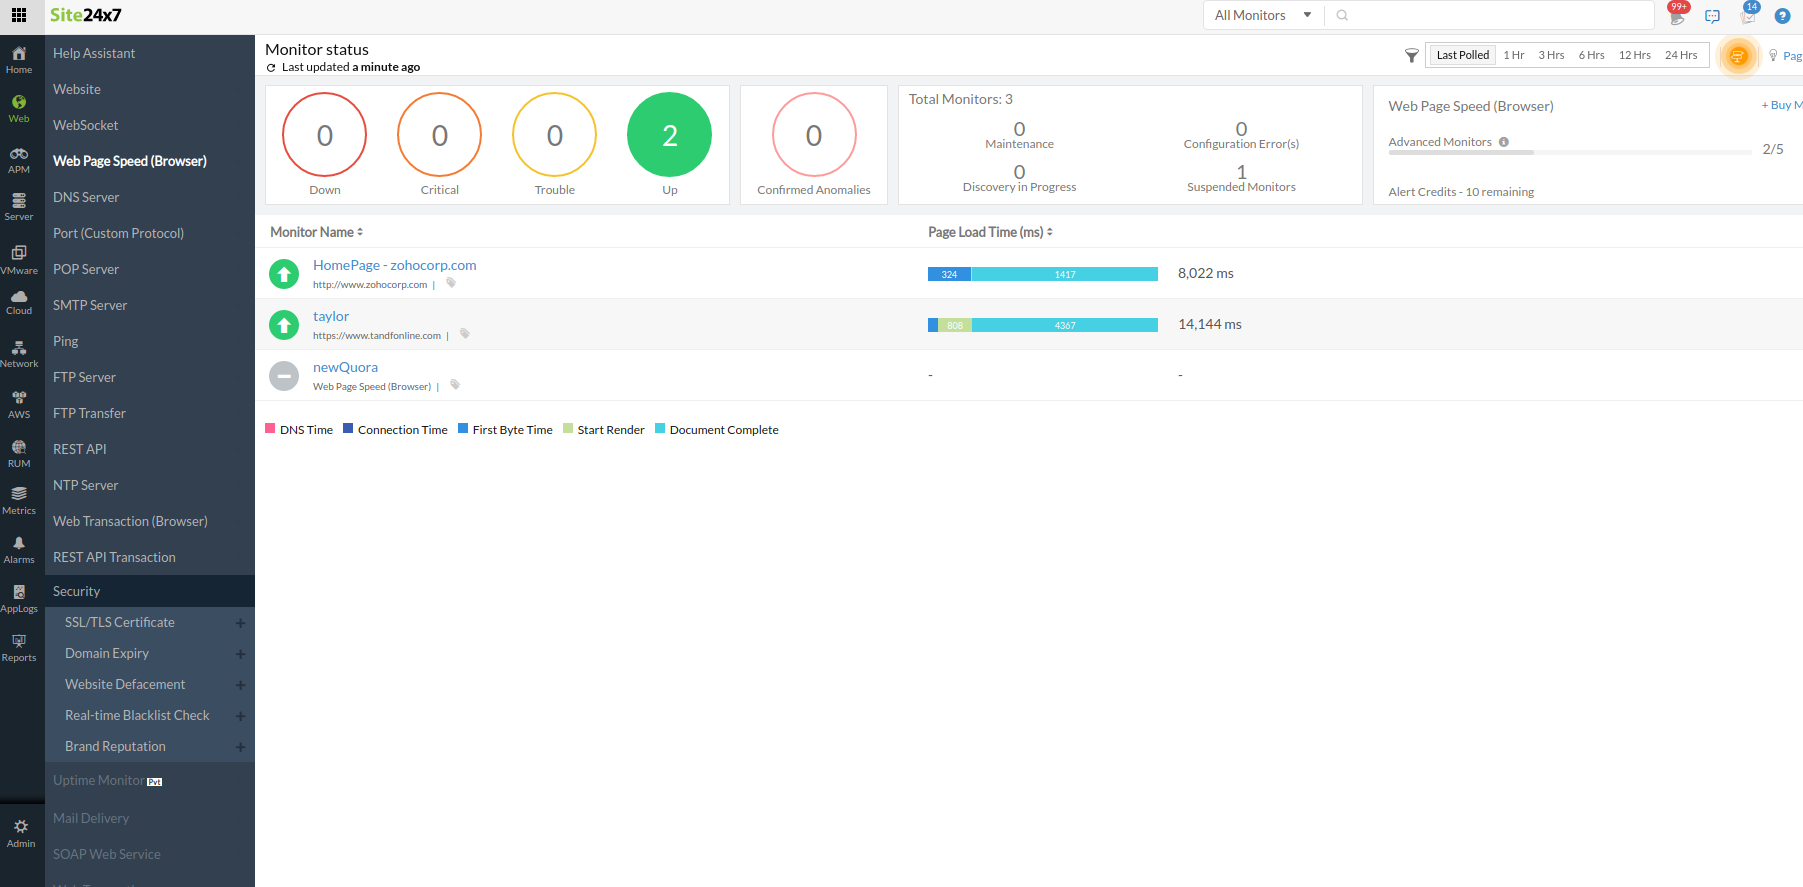
Webpage Speed (Browser) allows you to extrapolate your website performance by providing a split up of your website component's load time, response time, status, component size and more using a real web browser. Additionally, get to know the HTTP protocol (version 1.1 / 2.0) that is being used to render your resource. The main dashboard has a custom status banner, which identifies the various configured monitors by segregating them based on their operational status and state. You can also view the number of operational monitors and alert credits remaining in your account. By clicking the "+ Buy More" button, you can purchase additional monitors and alert credits. You can share the monitor details via an email. Email can be sent to only those verified users who have agreed to receive emails from Site24x7.
Events Timeline
Events timeline widget records all the past events of your selected monitor for a selected time range. You can identify/decode various events from the past, which includes Down, Critical, Trouble, Maintenance, Suspended, or Anomalies. Each event are color coded for easy identification. Events can be drilled down to extract maximum data and facilitate easy troubleshooting. You can also track the actual outage period and the total outage duration during a specific block of time.
Page Load Time
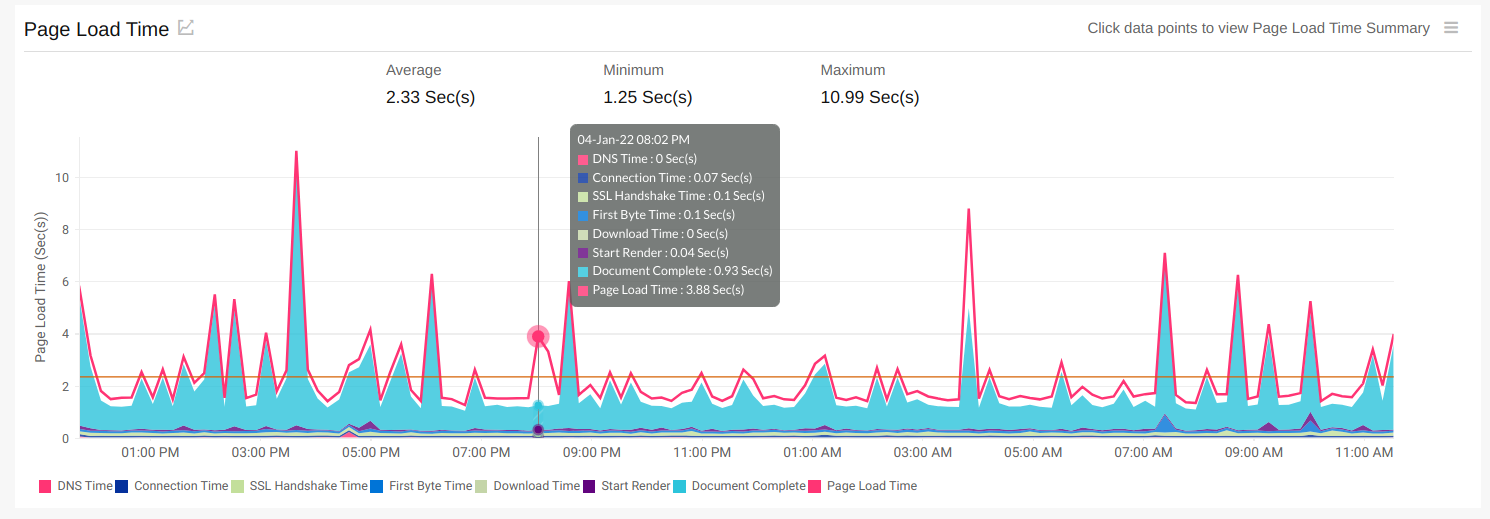
This section displays the historical information your website performance along with the availability, page load time, downtime duration, number of downtimes and SLA violation. The graph displays the page load time of various factors such as DNS Time, Connection Time, First Byte Time and Download Time, etc. It also shows you the maximum, minimum, average load times, and 95th percentiles (in milliseconds) of the webpage configured along with its Throughput values (in KB/sec). It also displays the global availability of the webpage, if configured.
Percentiles in Site24x7 can be used to find outliers. The 95th percentile is the value which is greater than or equal to 95% of the observed values of your polled data during the selected time range. In other words, 95% of the responses were faster than this value.
Average Page Load Time

The details can be read using the legend given under the graph. To know more about detailed calculations, read this article. These legend details are explained in detail below:
- DNS Time: The DNS Time is the time taken to resolve the domain name for the request. A spike in DNS Time indicates that is taking more time to resolve the domain.
- Connection Time: The connection time is considered as the time taken by the client to establish TCP connection with the IP address of the domain. More time to establish a connection may be due to factors such as server overloading which can be identified and addressed before it affects end-users.
- SSL Time: The time taken to complete the SSL/ TLS handshake. The handshake time includes confirming the identity of the server and the client, sharing details of the ciphers, signatures, or other options each party supports, and the creation or exchange of keys for data encryption.
- First Byte Time: The First Byte time is the time from when the connection to the server established until the first response starts coming in for the base page. This is actually the server response time plus network latency time. A spike in First Byte Time in your graph can indicate a delay in the processing of request in the server.
- Download Time: Download Time is the time taken for the last byte of the base page to be received from the server. An increase in the Download Time in your Response Time Graph indicates an extra amount of content transfer that may be happening during the request or due to low bandwidth available for content transfer.
- Start Render: The Start Render time is the time when some relevant portion of the webpage starts loading in the browser window. (i.e. the point at which the user is no longer seeing a blank white window).
- Document Complete: Document Complete is the point where the page has finished loading the entire content. At this point the page is ready for user interaction.
- Page Load Time: Page Load Time is considered as the total time taken to load the complete content of the response.
Web Vitals
Web vitals provide information on the performance of your pages and are helpful in providing a better end-user experience. You can obtain details related to the following web vitals from the waterfall chart:
- First Contentful Paint (FCP): FCP is when the browser renders the first bit of content the document object model or DOM. The first bit can be a text or image and FCP gives the user an initial heads up that the page is actually loading.
- Largest Contentful Paint(LCP): LCP measures the time a website takes to display the largest content on the screen to the user. It is generally said to include all content above the page's fold which appears without scrolling a page.
- Cumulative Layout Shift (CLS): CLS is a performance metric that measures the perceived visual stability of a page while loading. The result will be quantified as an aggregate score of all the individual layout shifts on that page. CLS is counted as one of Google's Web Vitals.
Page Load Time Summary
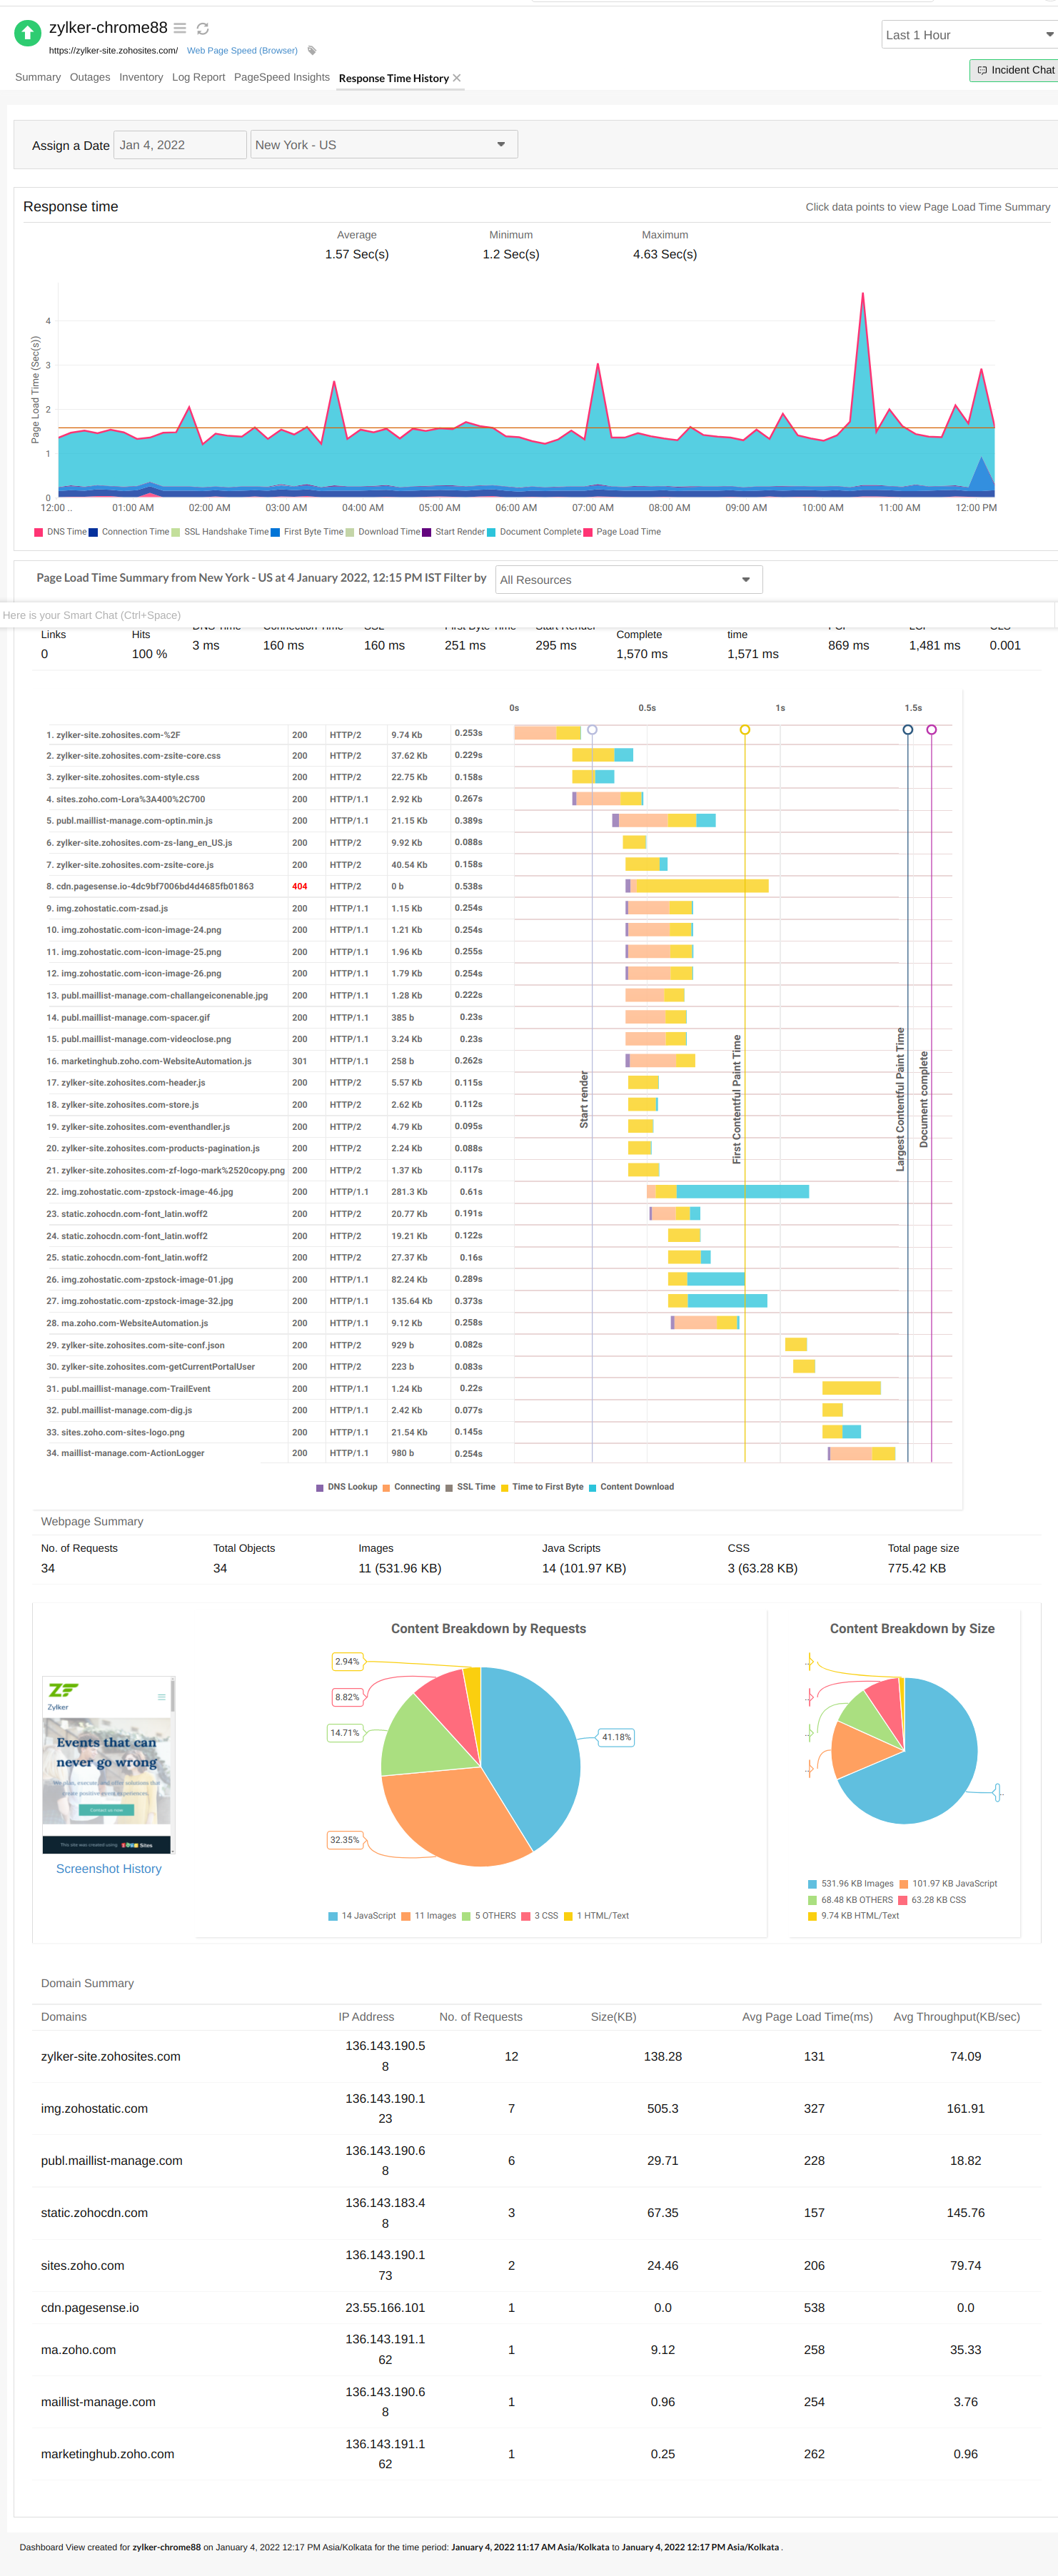
Page load time details for webpage elements like HTML, JavaScript, CSS, images etc. is shown in a waterfall model under this section. HTTP Status codes, size and page load time of each element is shown in detail along with breakup of the response time. This breakup includes DNS lookup time, connection time, first byte time, content download time, render start time and document complete time
If you've chosen your reporting period as Last 24 hours, Today, or Yesterday, then the Page Load Time Summary report will show you the actual page load time stats (RAW data) from your preferred location along with a dynamic water fall model during every data collection. Simply click individual data points in the Page Load Time graph to view the actual Page Load Time stats during that data collection. Similarly, if you want to see the page load time summary, domain summary and webpage summary for the past seven days, click the View History link. To view request and response headers, click on the respective URL.
Waterfall Chart:
The waterfall chart illustrates various elements of the URL, including its status code, response time, size, HTTP version, unsecured links, CDN hits, failed resources, SSL time, first-byte time, etc. It provides a visual representation of each component's contribution to the page. This insight helps identify the components causing longer load times.
By clicking on Share This, you will be able to copy the permalink of the waterfall chart, view it on a separate page, and share the public link with others. The link will remain valid on the clipboard for seven days.
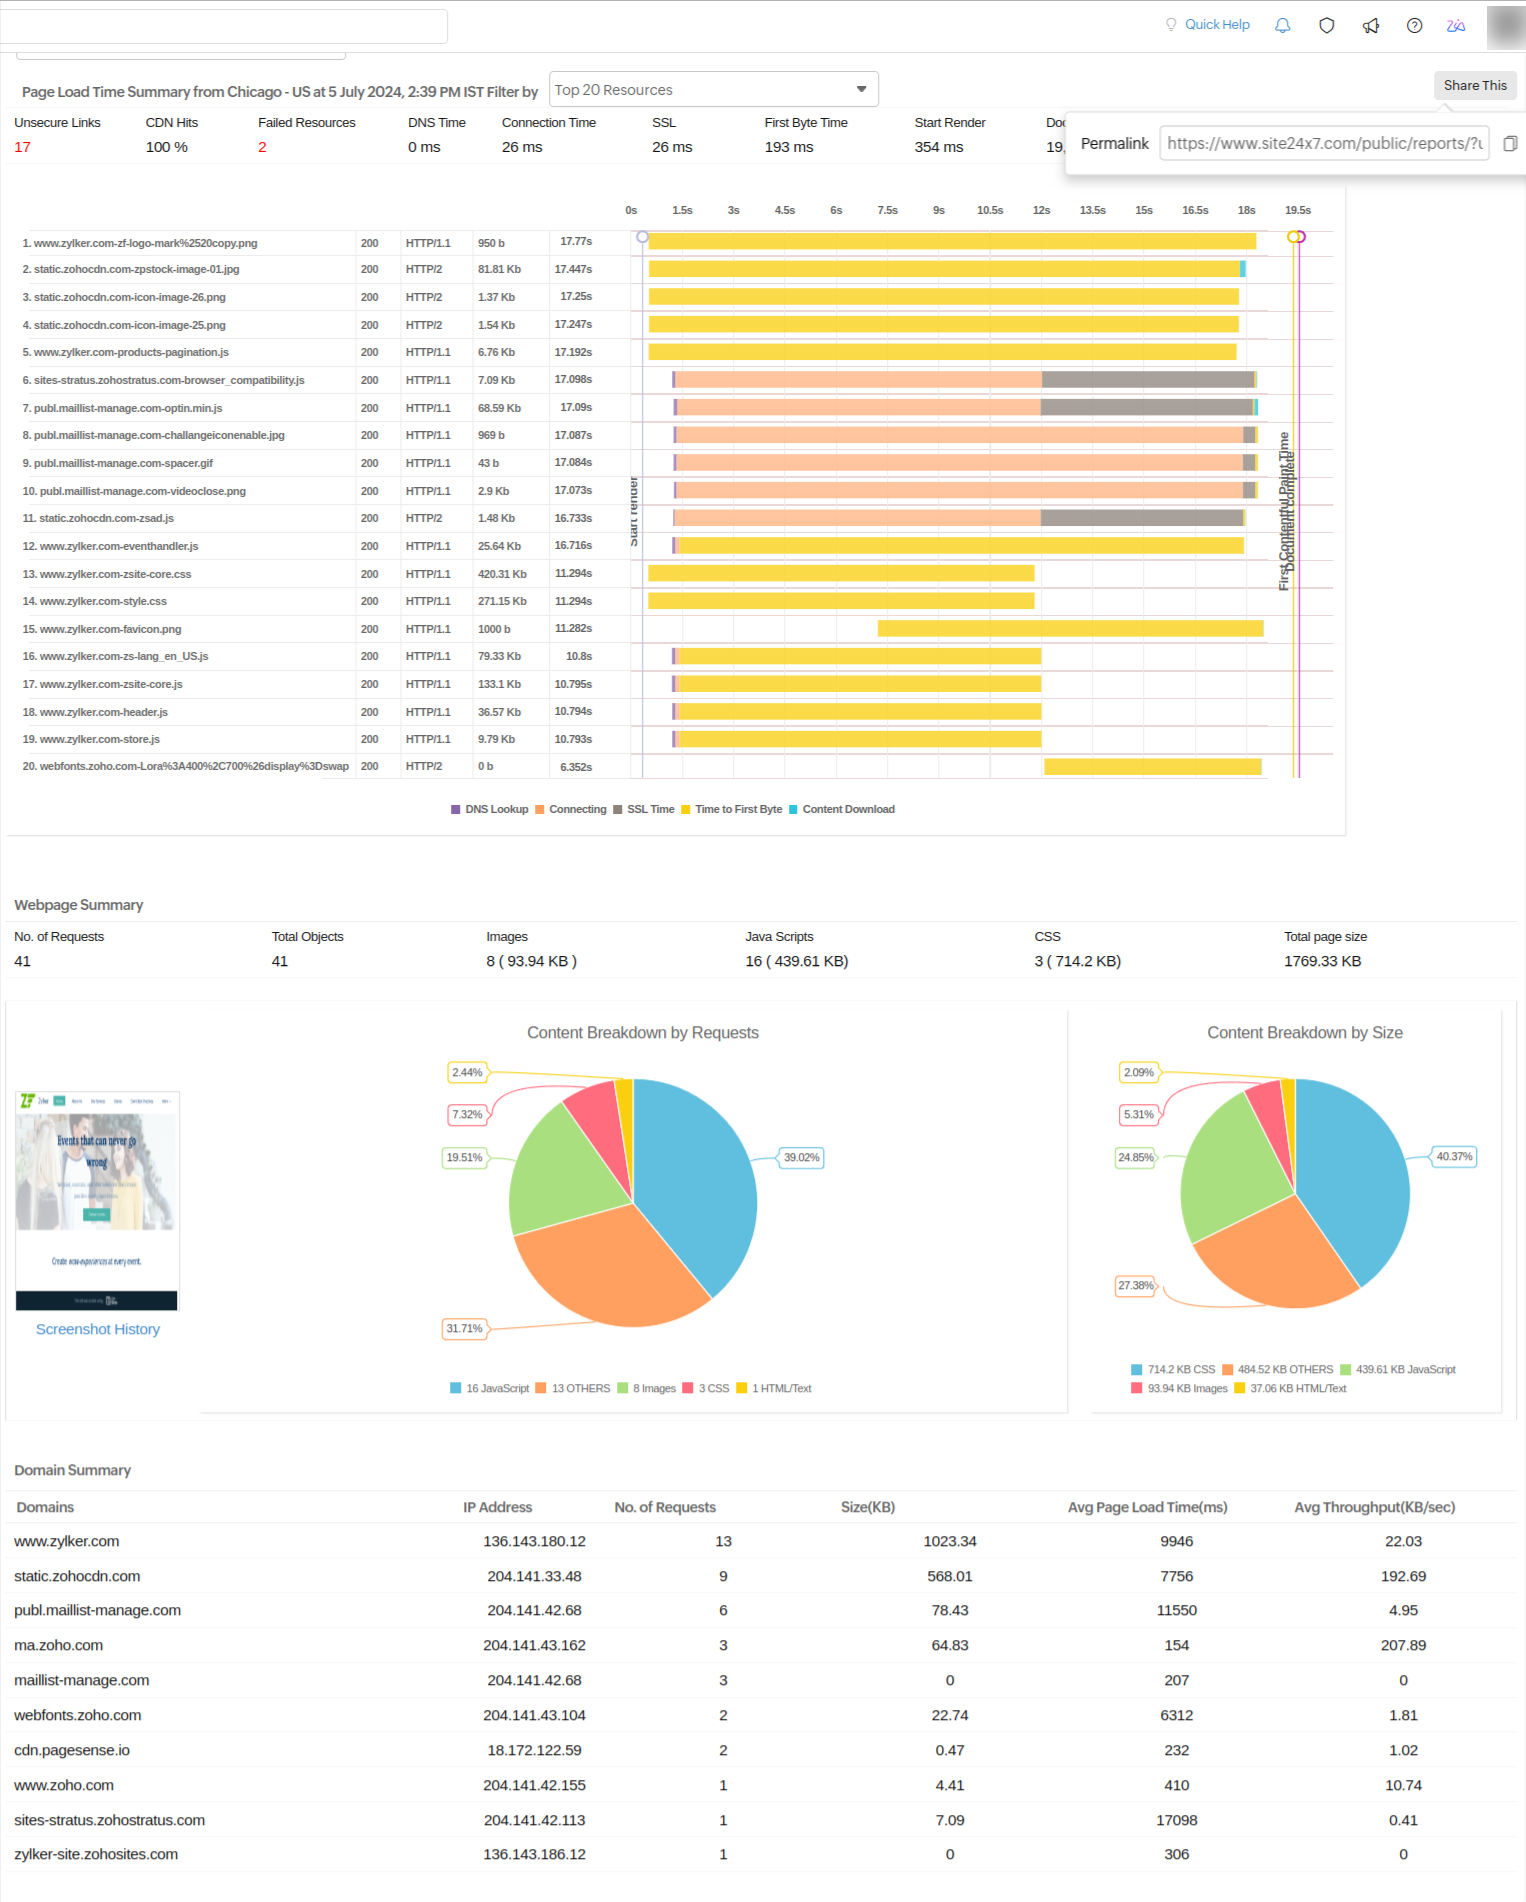
Unsecure Links: The number of URLs with HTTP or an unsecure connection will be listed here as Unsecure Links.
You can now filter your resources using the drop-down option. The filters available are: All Resources, Top 20 Resources, Top 20 Resources by Size, Top 20 Images, Top 20 JS, Top 20 CSS, Unsecure Resources ( URLs with HTTP will be listed here), CDN miss Resources, and the various domains with the number of links embedded in it. The top 20 resources/ images/js/css /domains are selected by listing the resources with highest response time in descending order.
CDN Hit %: (Number of hits/ Number of links with hit and miss)*100
The allowed headers are: x-cache, x-cache-status, x-cache-hits, cf-cache-status, server-timing, x-proxy-cache, x-origin-cache, akamai-cache-status.
CDN Hit will be declared if the header values are: HIT, HIT; HIT,MISS; MISS,HIT ; DYNAMIC ; H; 1,1; 1,0 ; 0,1; 1
It will be a CDN Miss if the header values are: MISS,MISS; 0,0; 0
Webpage Summary
This section displays summary of all the elements of the webpage that is being checked using real browsers. This summary will include number of requests sent before the page has finished loading, total number of objects in the page and the number of images, JavaScript and CSS included in the objects. This will also include the total size of the webpage. Two pie charts; Content Breakdown by Requests and Content Breakdown by Size are displayed in the summary of the webpage.
Webpage Summary section will also show a screenshot of the webpage that is analyzed.
Domain Summary
This section will show you the number of requests sent for each of the domains under a particular URL, the version of the HTTP protocol used to render the resource in our agent, and the response time for each of those domains.
For example:
Under the URL www.mysite.com, images are loaded from images.xyz.com, advertisement banners are loaded from ads.sample.com and so forth. Number of requests sent to each of these domains, HTTP version (1.1 or 2.0) and the response time taken by each of them is elaborated in domain summary section.
Other details that are included are size (KB) of each domain, average response time (in milliseconds) for each request and the average throughput value (content length/response time).
Response Time History
You can view the overall response time history, including the Page Load Time Summary, Webpage Summary and Domain Summary for a specific poll during the last seven days. This data can be obtained from each of your monitored locations. Since the RAW page load time data is shown in this report, you can assign a specific date from the past seven days and click on a specific instant in time on the page load time graph to view the Response Time Summary waterfall chart for that time.
Availability and Page Load Time by Location
Location wise Availability percentage, Page Load Time (ms), Downtime Duration, number of Down times and Last Downtime details will be shown in table format. All the chosen locations will be included under Location.
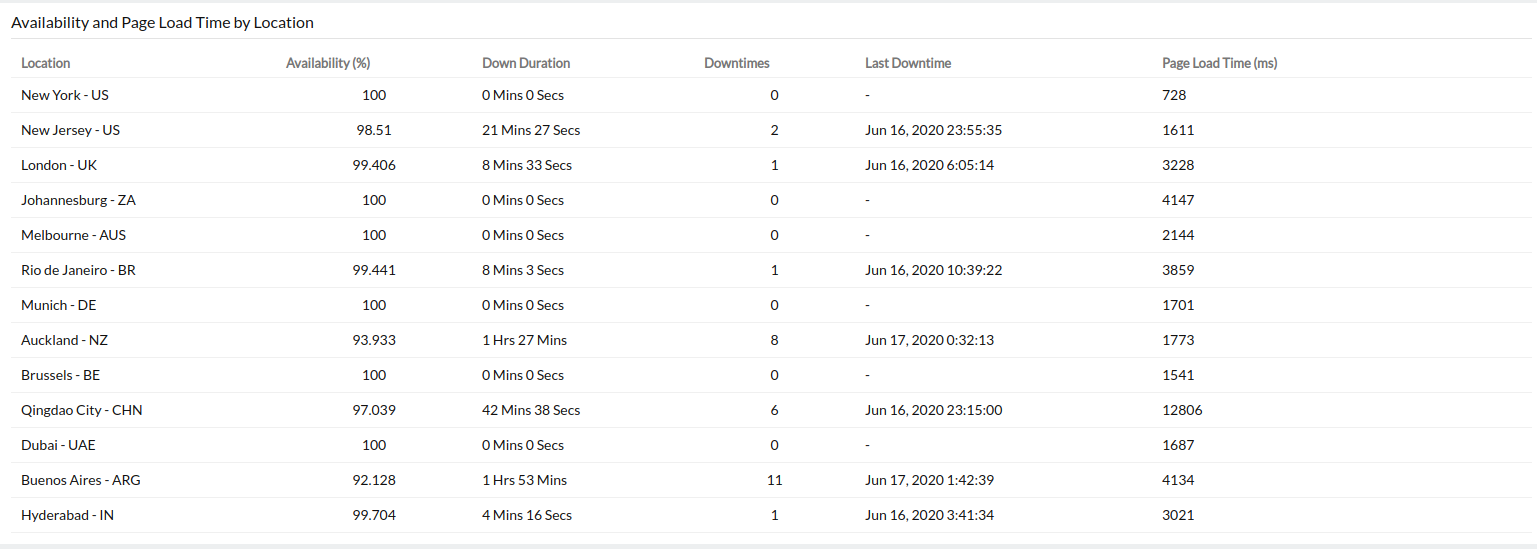
Apdex Scores:
With our RUM integration widget, you can instantly use the Apdex industry standard for measuring the satisfaction of a user using your application or service, you can understand how your applications are performing from your users’ perspective, i.e, “Satisfied”, “Tolerating” or “Frustrated”.
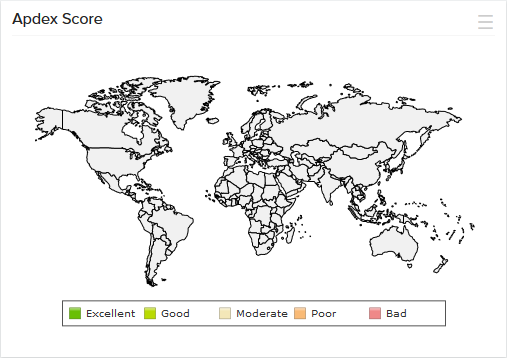
Lighthouse Report
Lighthouse is a open-source tool which can be used to analyze the speed and performance of your webpage. You can run it against any webpage, whether it's public or requires authentication, and it has audit reports for performance, accessibility, progressive web apps, SEO, and more. If you have a webpage speed (browser) monitor in Site24x7, you can then obtain a detailed Lighthouse report for the URL you've added for monitoring.
When you submit a URL for auditing, Lighthouse runs a series of audits against the page, and then a report will be generated on the performance of the page. For example, a URL to test the webpage speed in a browser can be used to generate a Lighthouse report. Each audit will have a reference or suggestions section that states in detail the relevance of an audit and the measures to be taken to fix it.
Lighthouse has audit reports for five main website optimization categories:
Performance
In this audit, Lighthouse measures the quickness with which the page loads and the ease of access for users. The audit reports include data on five-speed metrics related to the performance of the webpage, each measuring some aspect of page speed.
- First Contentful Paint (FCP): FCP is a metric that measures the time at which the first text or image loads on a page for users.
- Largest Contentful Paint (LCP): LCP is a measurement of the time a page takes to load the largest element.'
- Total Blocking Time (TBT): TBT measures the time that a page is blocked from responding to a user’s input.
- Cumulative Layout Shift (CLS): CLS measures the layout shifts that take place when a user tries to access a page.
- Speed Index (SI): SI shows how quickly the content of a page loads.
A score will be assigned based on the page's performance after all the metrics have been considered. The score can range from zero to 100.
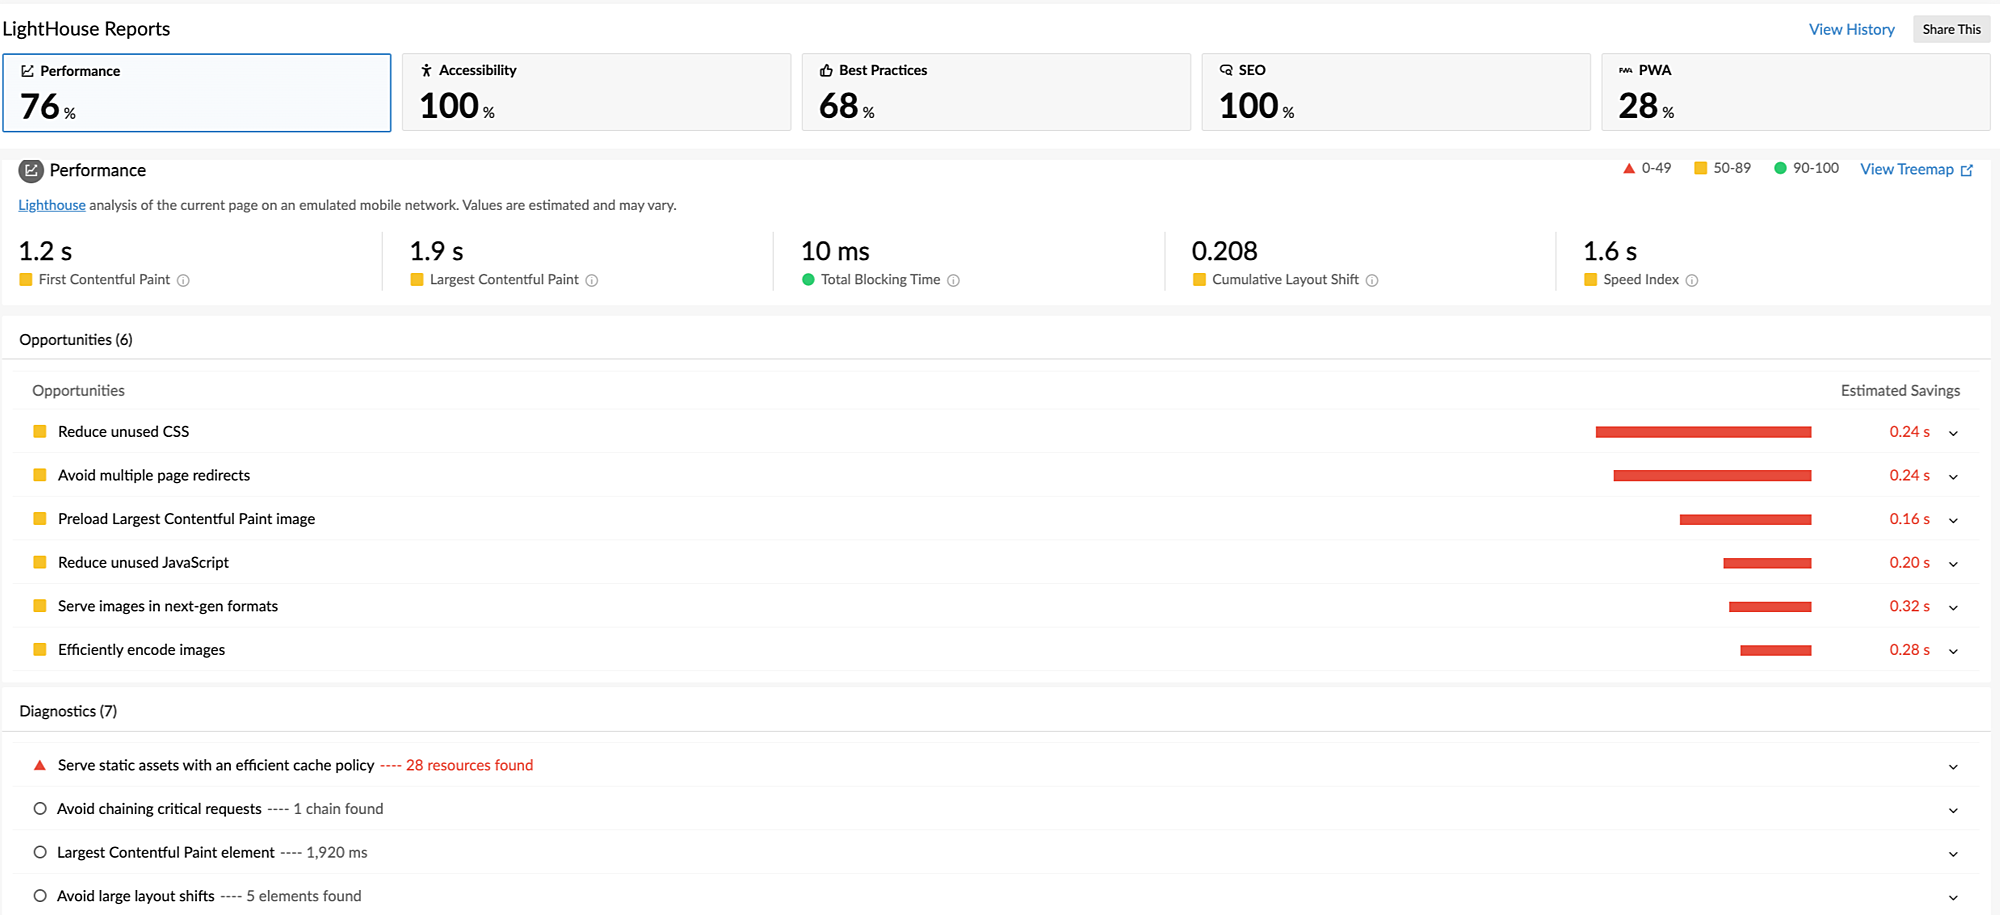
Accessibility
Lighthouse’s accessibility test verifies how easily people who use assistive technologies can use the website. Various elements on the page, like buttons or links, will be checked to see how user-friendly they are. Images will also be checked to ensure the presence of alt text, as that might help users with limited or no vision who read with the help of screen readers.
Similar to the audit on performance, the accessibility report also allocates a score out of 100.
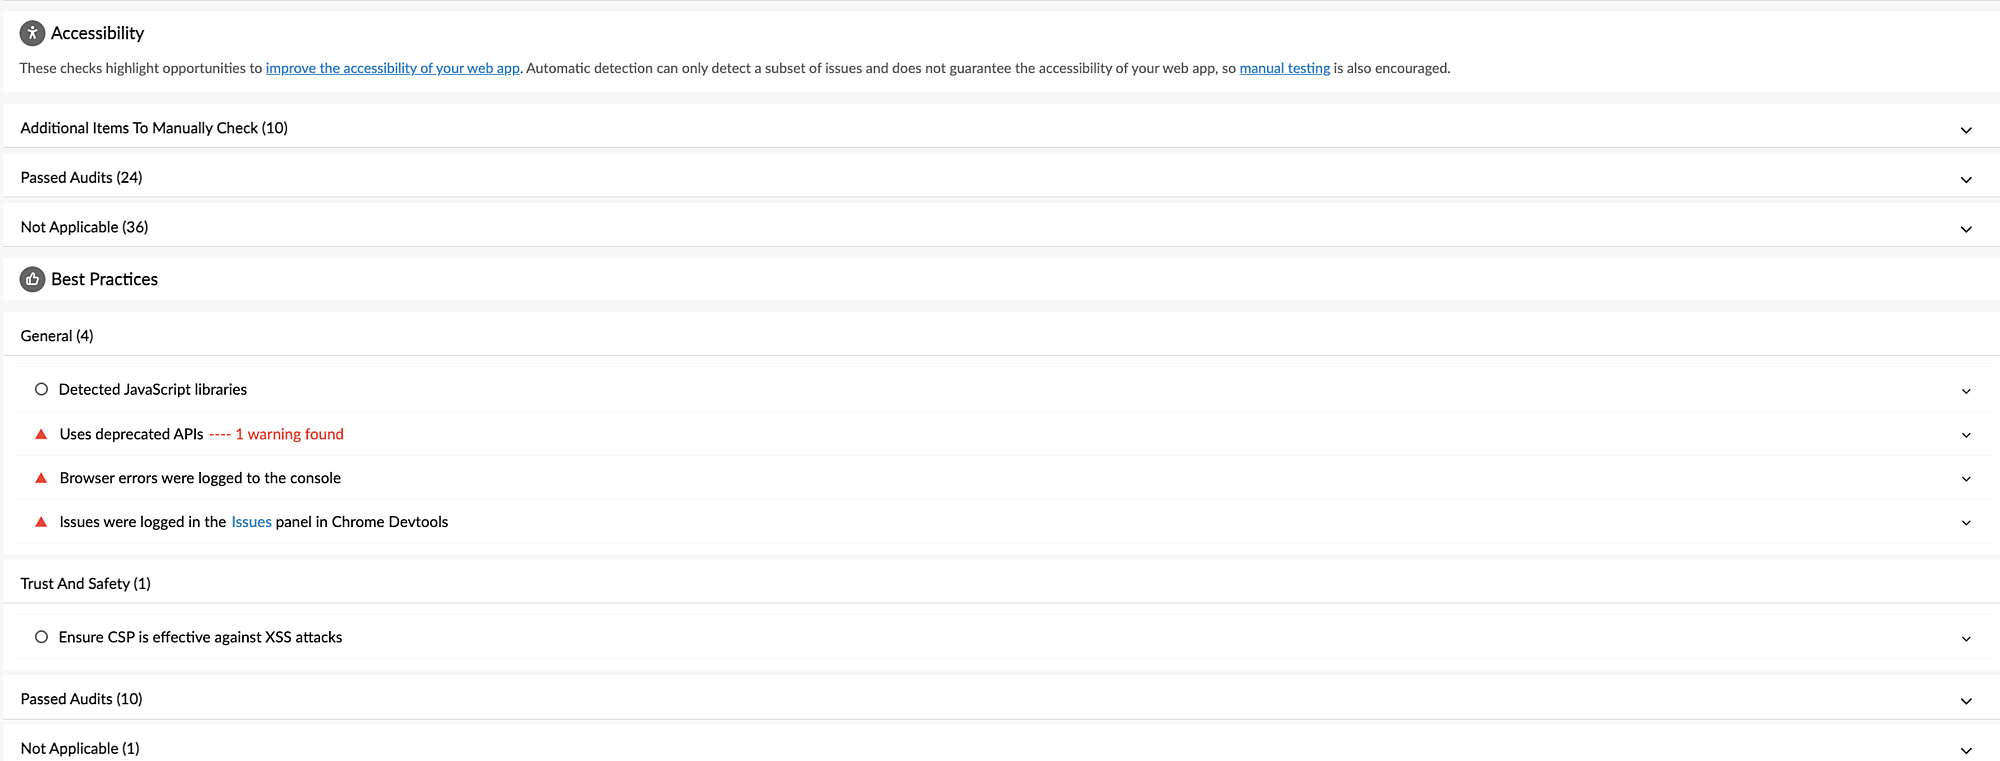
Best Practices
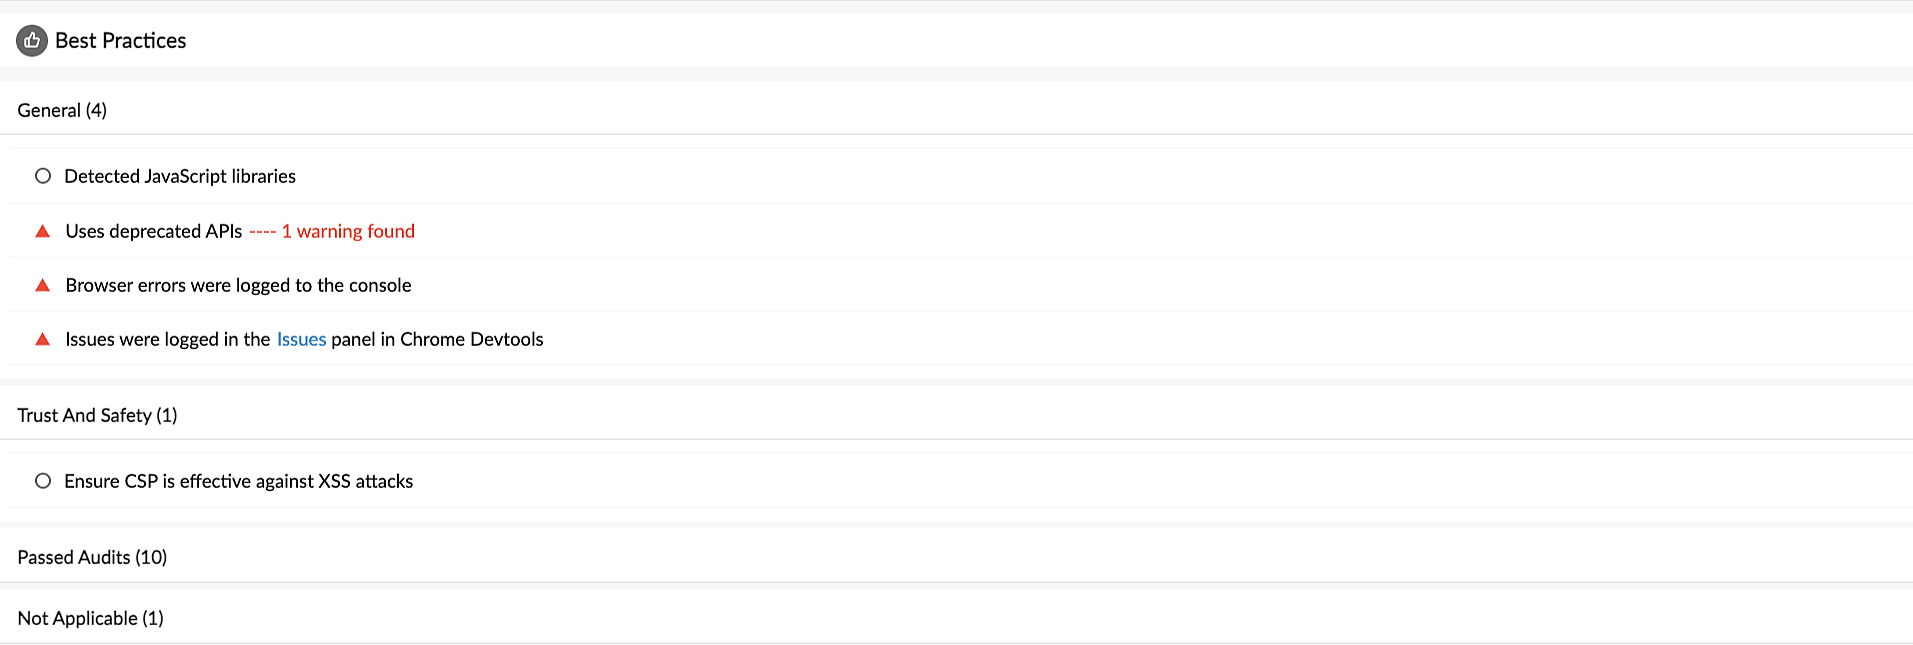
The Best Practices audit will analyze whether the page follows the modern standards of web development. The audit checks whether:
- The resources load from HTTPS-secured servers.
- The images have the correct aspect ratio and appropriate resolution.
- The JavaScript libraries are safe and free from vulnerabilities.
- The content security policy is stable against any cross-site scripting attack.
- The page has no browser errors.
- The page contains no deprecated frameworks or APIs.
- There are valid source maps for the page.
- The page has no issues appearing in the Chrome DevTools panel.
- The page offers a better user experience.
The performance of these factors will decide your score out of 100.
SEO
This audit analyzes a webpage to identify technical aspects that can impact SEO.
It checks whether the:
- Page is mobile-friendly.
- Page has a valid structure.
- Internal links can be crawled.
- Page possess a valid hreflang attribute.
- Page has title and meta description tags.
- Page can be indexed.
- Robots.txt is valid.
- Links on the page have contextual text.
- Images have alt texts.
- Page contains a viewport meta tag.
The maximum score that can be assigned under this audit is 100.

PWA
ThIs audit checks whether your web application uses modern web capabilities to ensure a better user experience.
It checks whether the web application:
- Is fast and reliable on mobile networks and offers offline functionality.
- Can be installed on multiple device types.
- Is PWA-optimized by redirecting HTTP traffic to HTTPS.
Once the test is run, you're assigned a PWA badge.

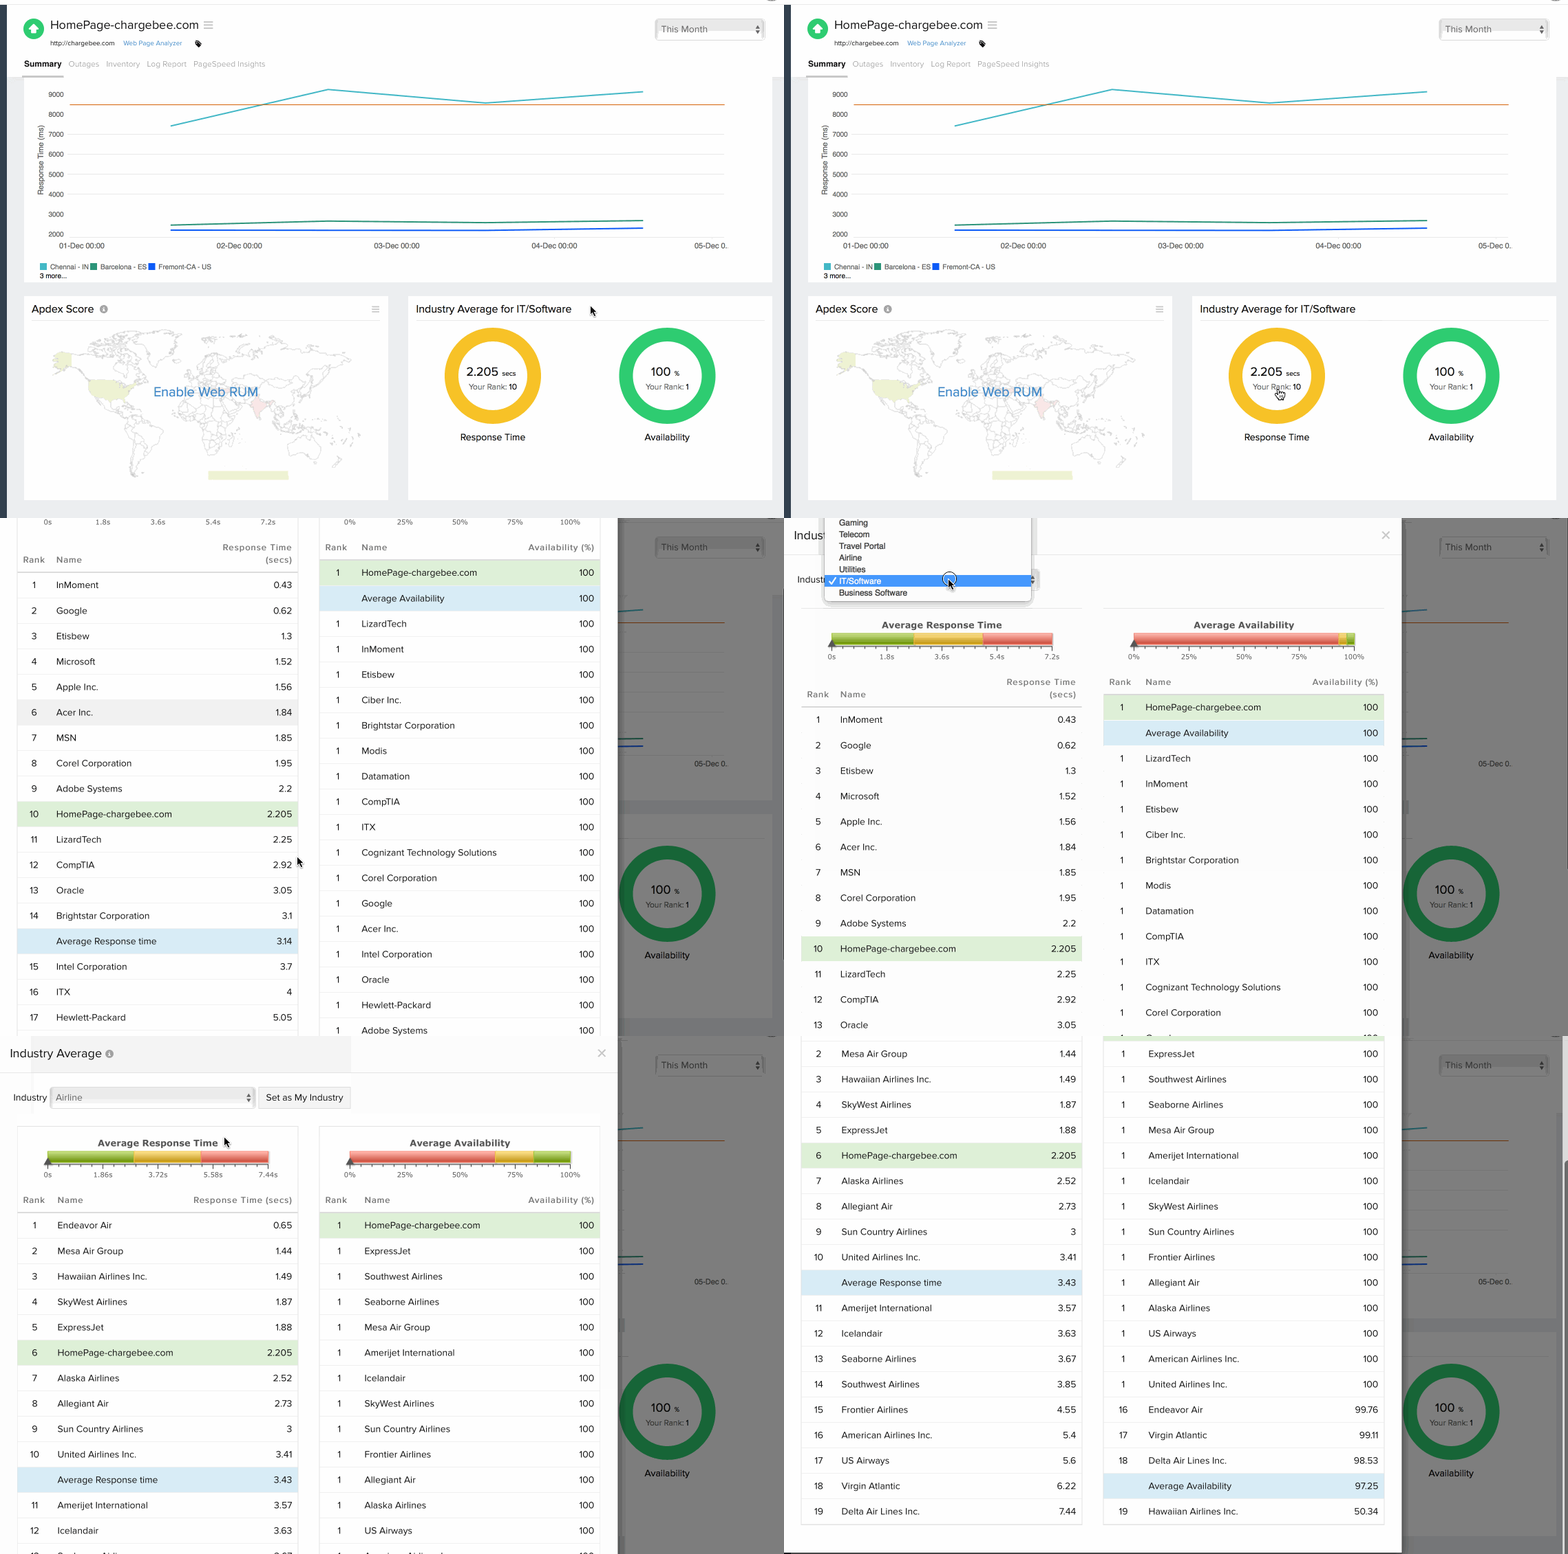
Performance Benchmarking:
The benchmarks widget is now integrated with-in the client letting you compare your website performance with industry peers. With our performance benchmarking widget, you can instantly view and compare your average response time and availability of your service with respect to your industrial peers. This can be viewed across various industrial verticals.
Outages
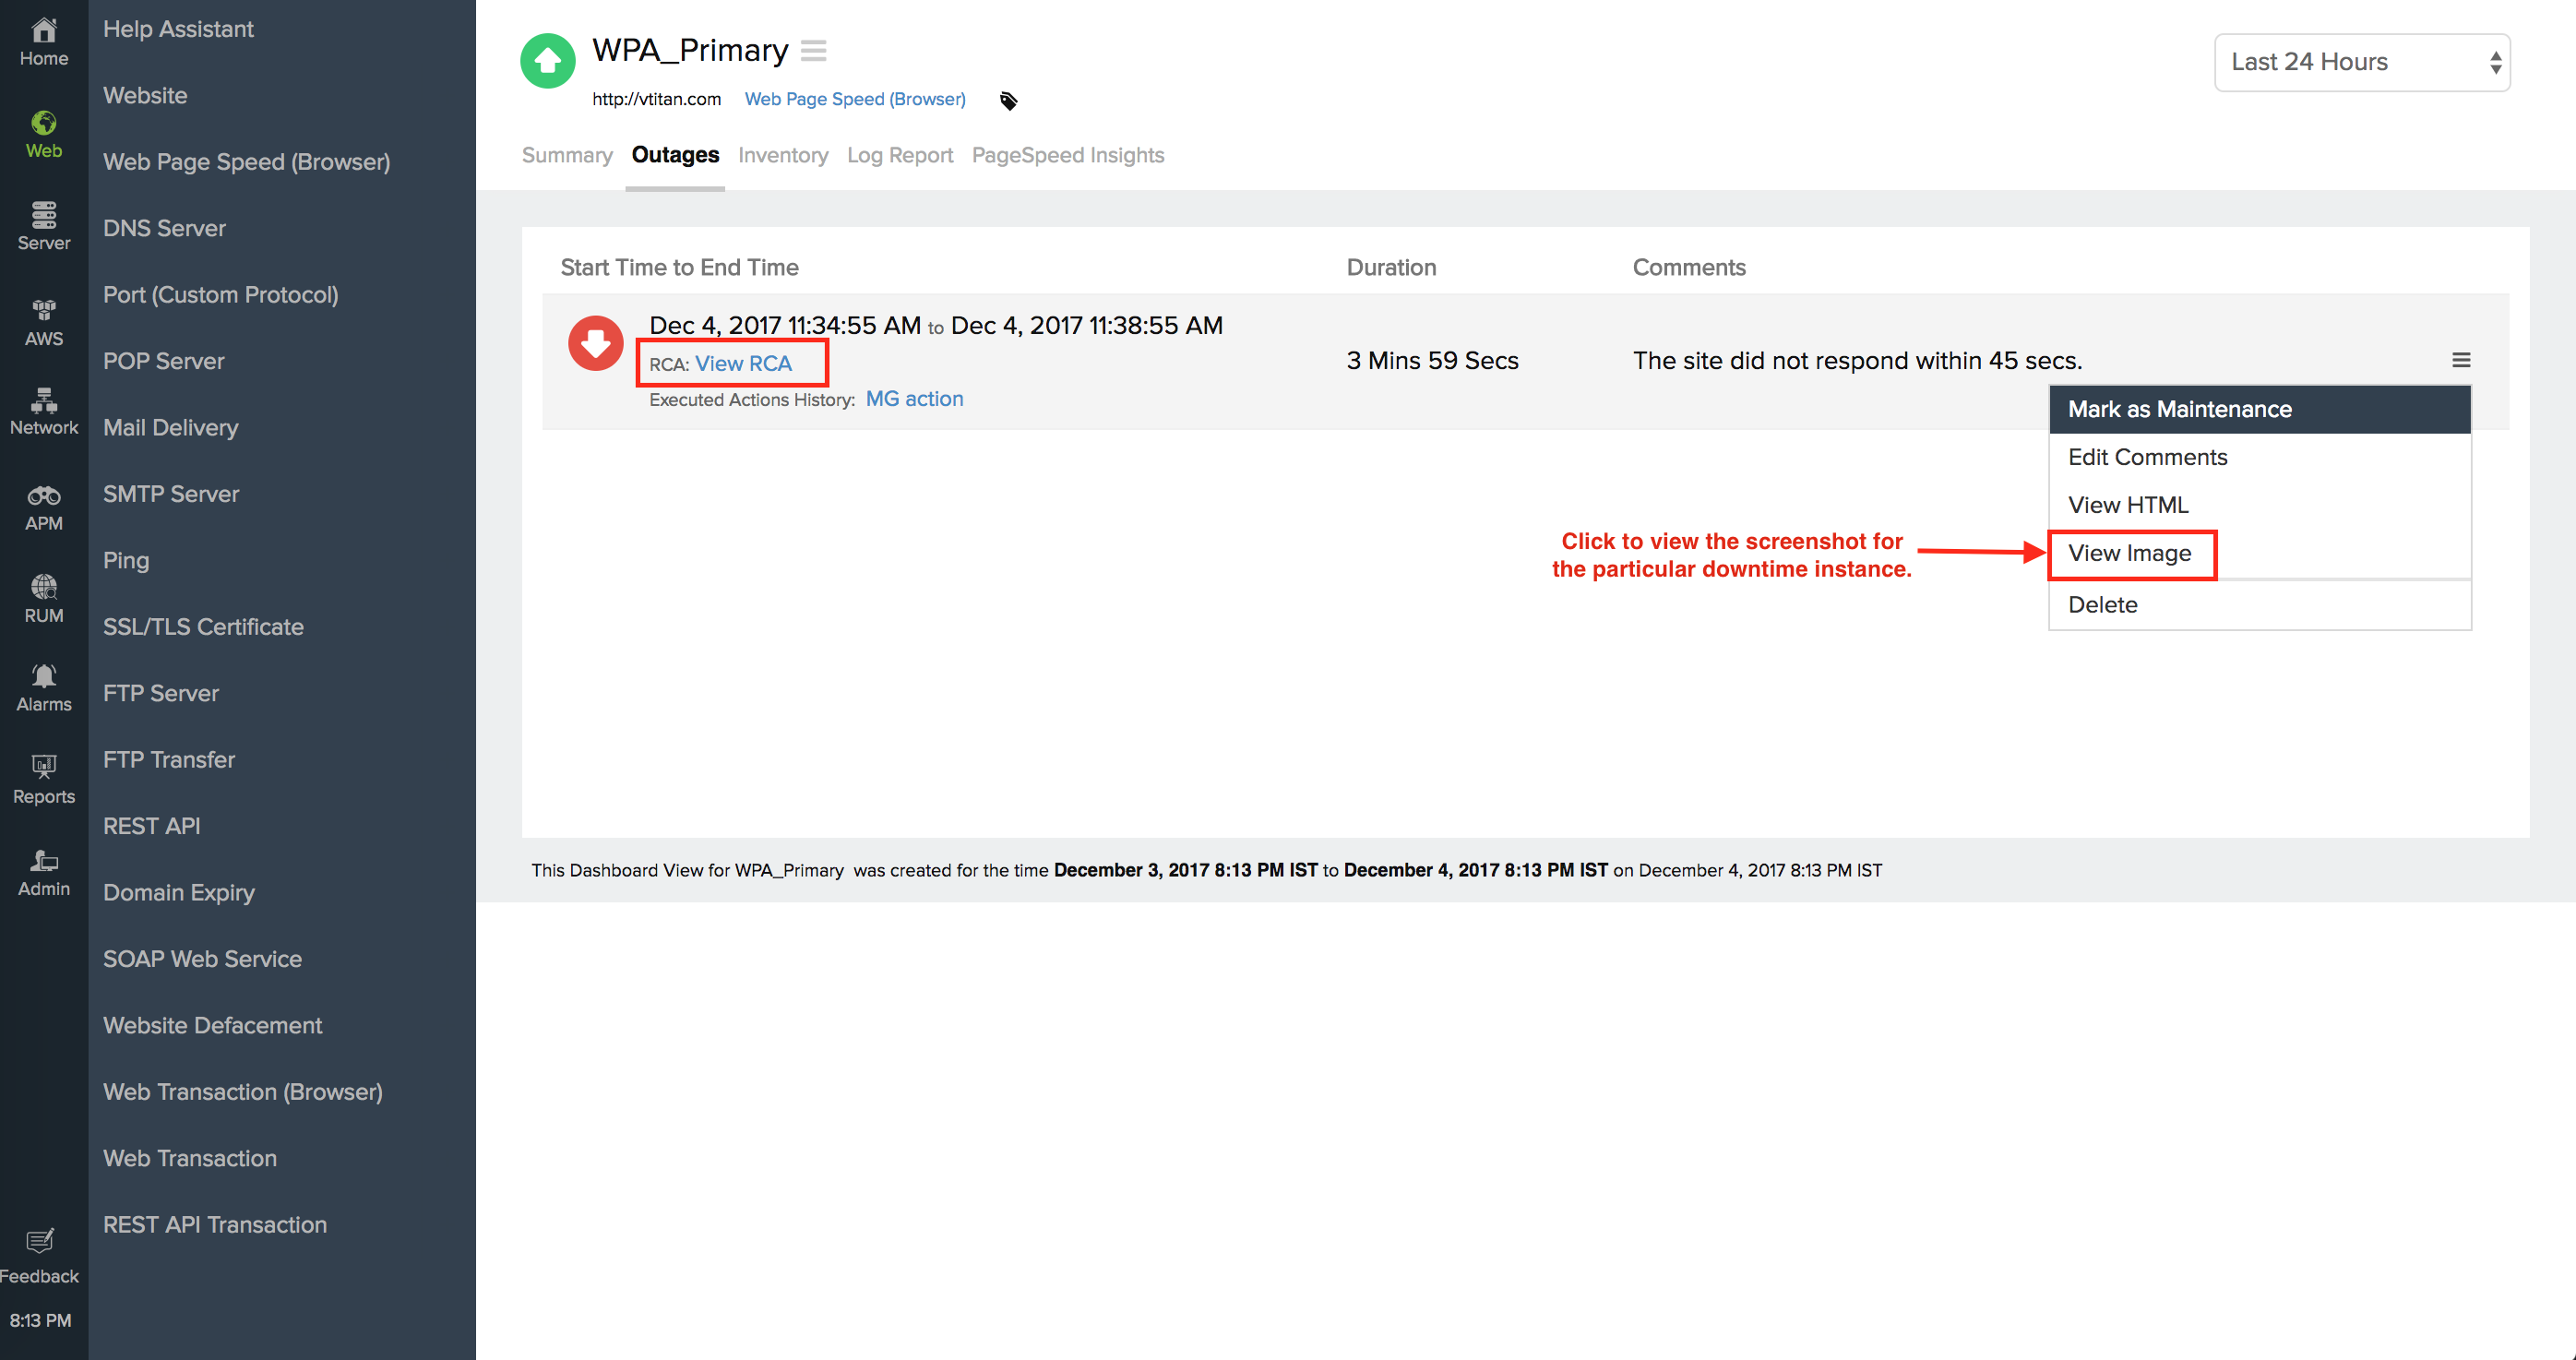
You can access the Outages tab in your monitor's details page to gather detailed insights on the various outage and maintenance downtimes. It provides you with sufficient information to troubleshoot issues. You'll also be able to access the root cause analysis reports for your various outages. On accessing the ![]() icon of a listed monitor outage or maintenance, you'll be shown the options to:
icon of a listed monitor outage or maintenance, you'll be shown the options to:
- Mark as Maintenance: Mark an outage as Maintenance
- Mark as Downtime: Mark a Maintenance as Downtime
- Edit Comments: Add/Edit Comments
- View HTML: View the error response in HTML format obtained during a failed content check
- View Image: View the RCA screenshot for the outage
- Delete: Delete an Outage/Maintenance permanently
Root Cause Analysis (RCA) Report:
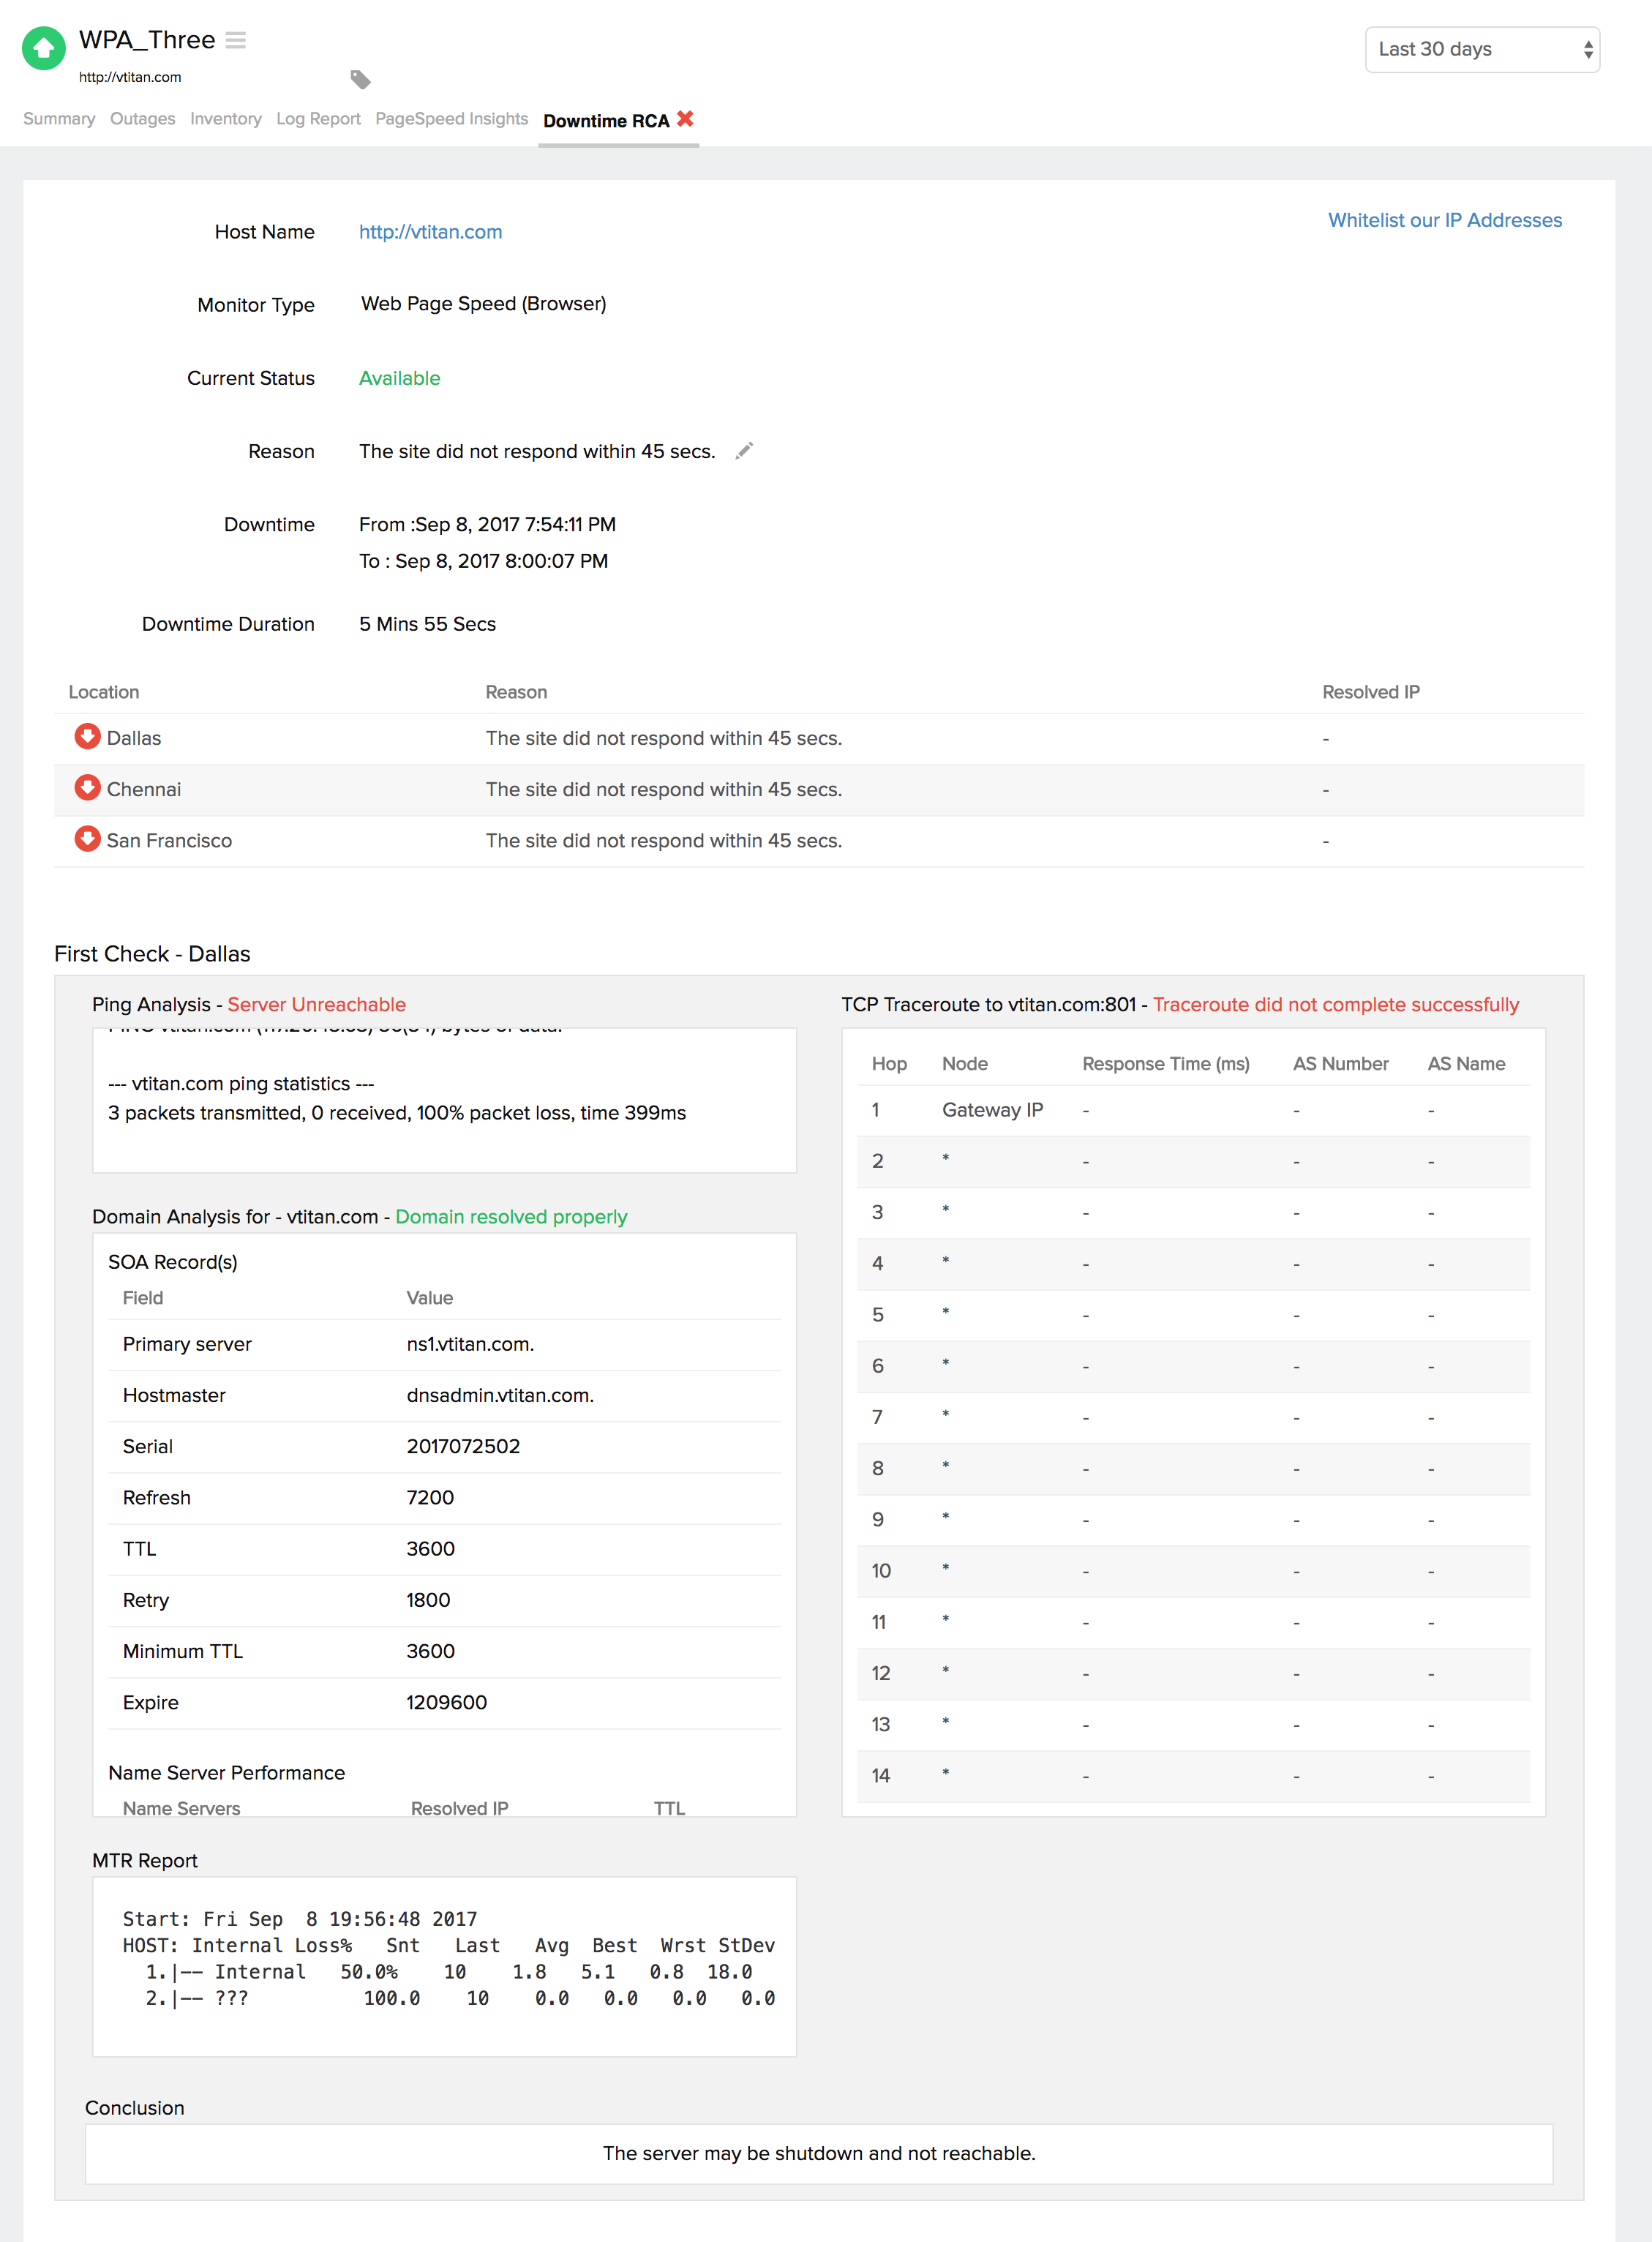
You can retrieve indepth root cause analysis report for your DOWN monitors after 150 seconds of the monitor reporting the outage. RCA Report gives basic details about your monitor, outage details, recheck details and reasons for the outage. Root Cause Analysis automatically generates a plethora of information to arrive at a definite conclusion as to what triggered a downtime. RCA intends to determine the root cause of specific downtime or performance issue. A normal RCA report will comprise of the following details:
- Checks from Primary location and re-checks from Secondary location.
- Ping Analysis
- DNS Analysis
- TCP Traceroute
- MTR Report
- MTR based Network Route
- Compare screenshots, HTML, and resources
- Conclusion
Compare screenshots, HTML, and resources
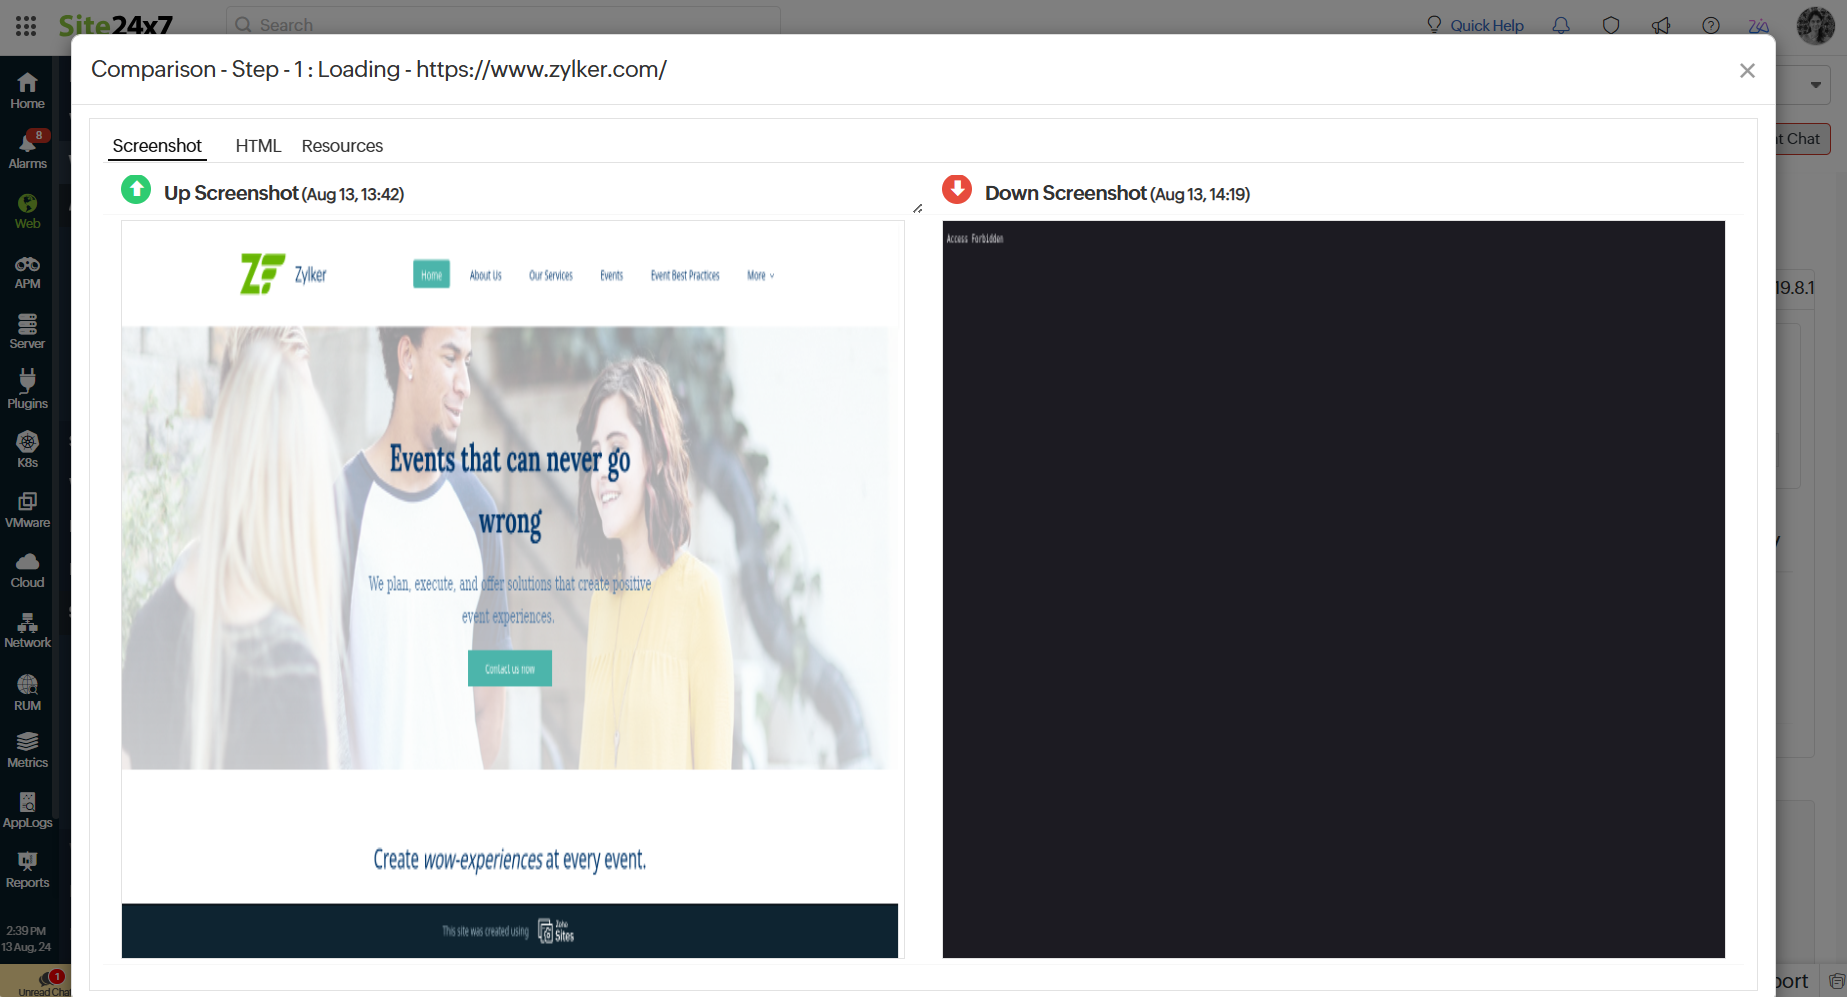
You can use this option to check the difference between screenshots, HTML, and resources in the RCA report. The old responses will be on the left, and the new ones will be on the right.
This feature is helpful for identifying any changes in the web application. For example, if your company uses an application and an update makes it inaccessible to users, this feature can help pinpoint where the issue is occurring, and you can allocate developers to fix it promptly rather than having to debug the entire application.
- Screenshot comparison: This feature allows you to compare a screenshot taken when the monitor transaction step was up with a screenshot from when the monitor transaction step was down. It also provides the date and time of each screenshot. Comparing the screenshots will help you identify any differences.
- HTML comparison: This option lets you compare the HTML code of the application or webpage from when it was up recently to when it was down to analyze any change. Added lines are highlighted in green, while removed lines are highlighted in red. You can use the Prev Diff and Next Diff functions to move between the differences in the HTML. This makes it easier to spot variances in the HTML content.
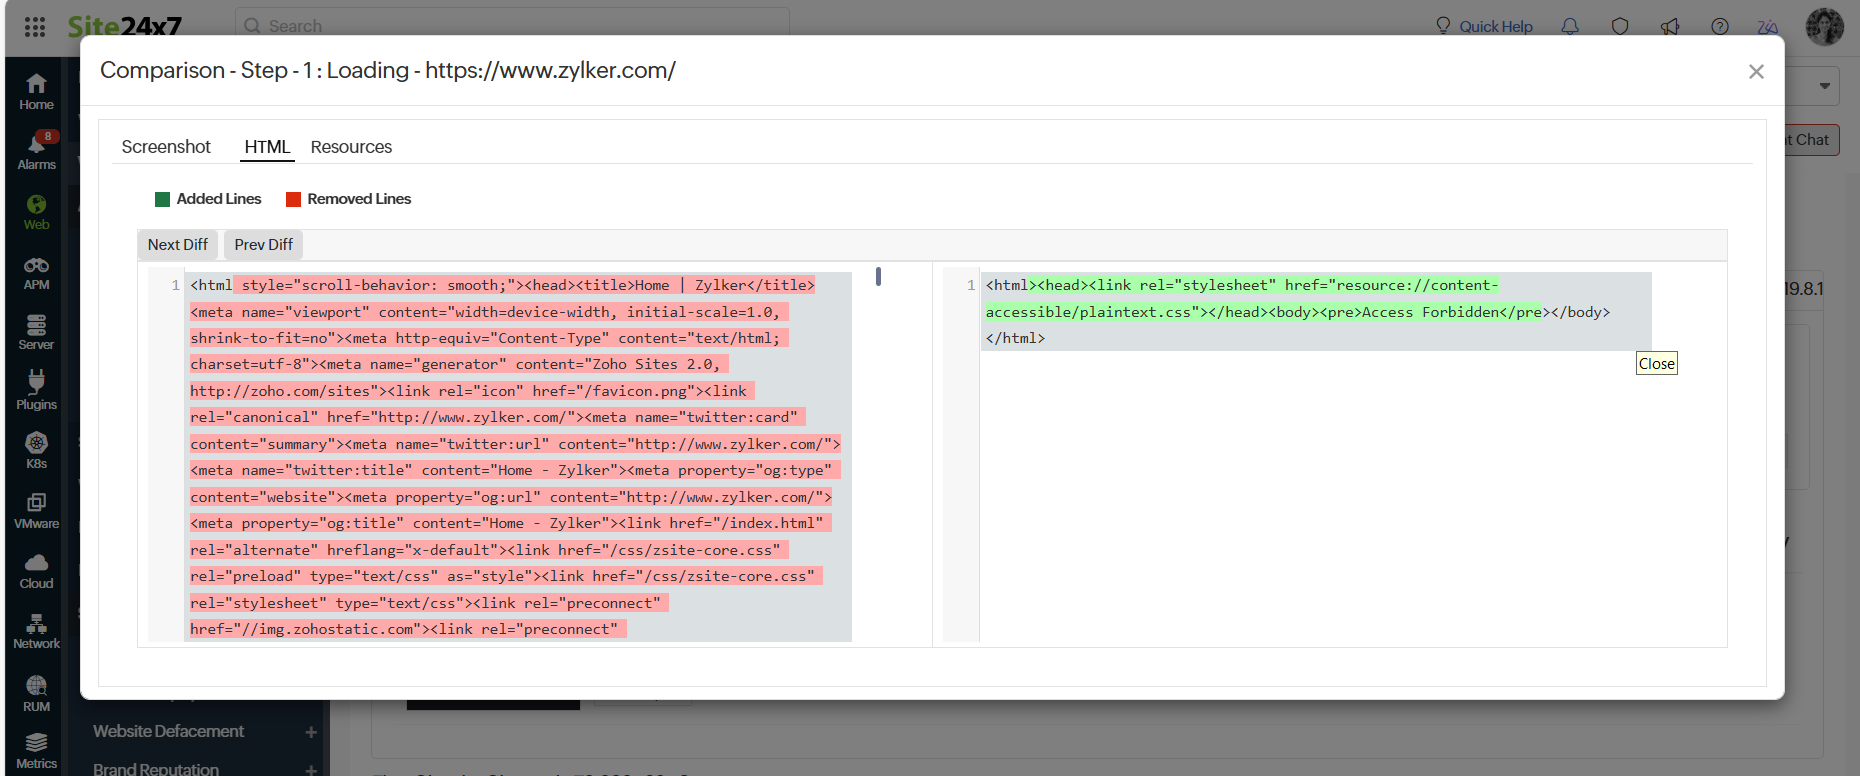
- Resource comparison: Compare the resources of the down page with the recent resources of the up page.
This feature lists all the resources that differ from the current down page along with the URL's last uptime. It presents error codes and the corresponding resources in a tabular format, including URL, Protocol, Response Code, Response Time (ms), and Size (KB).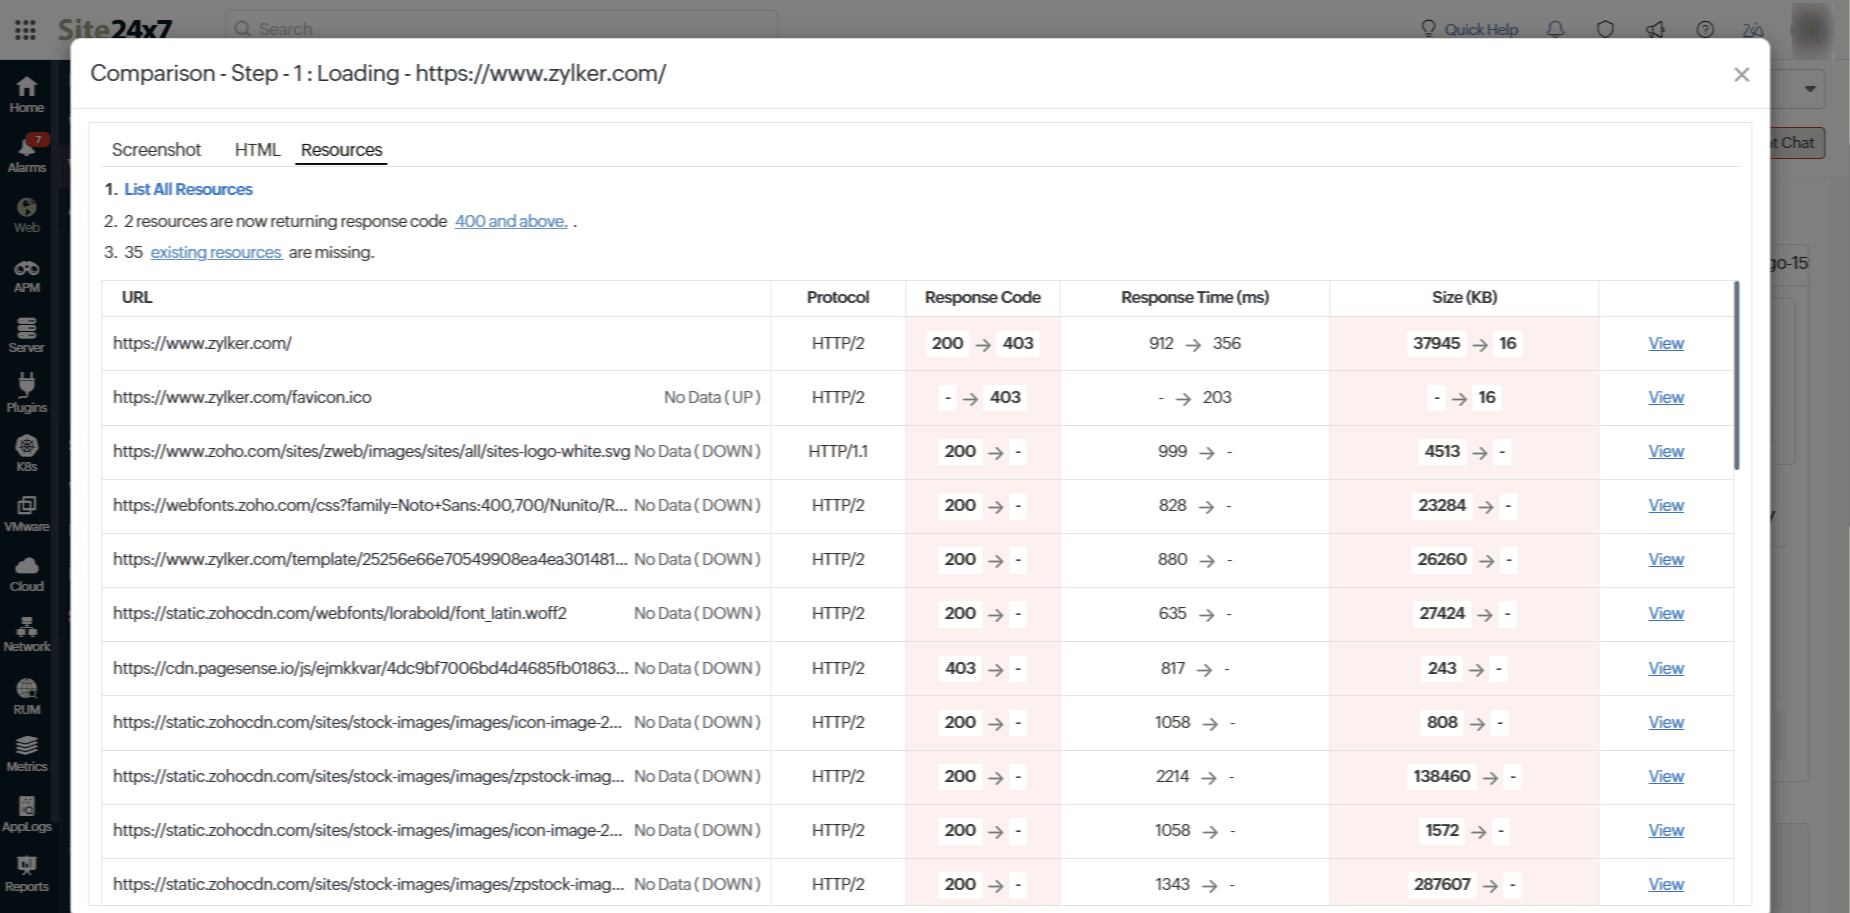
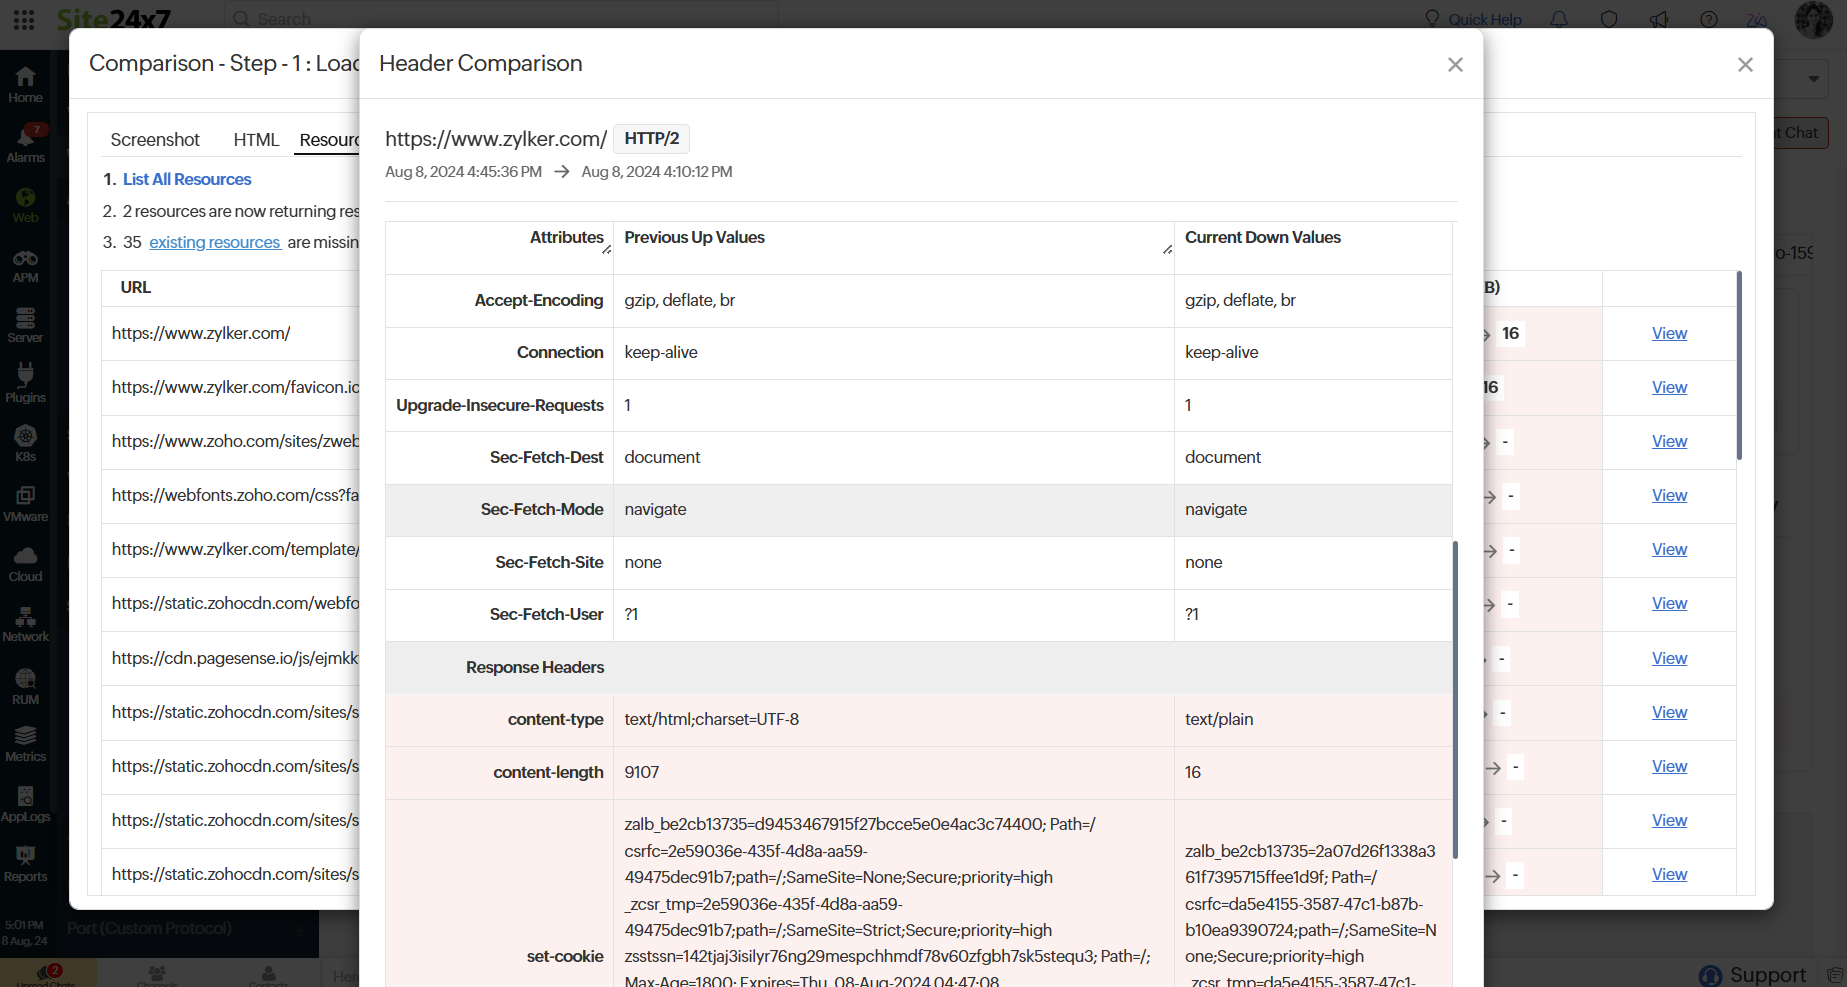
Clicking the View link provides a Header Comparison, which offers comparison information such as previous up and current down values for the selected resource, aiding users in understanding the underlying issue.
Inventory and Notes:
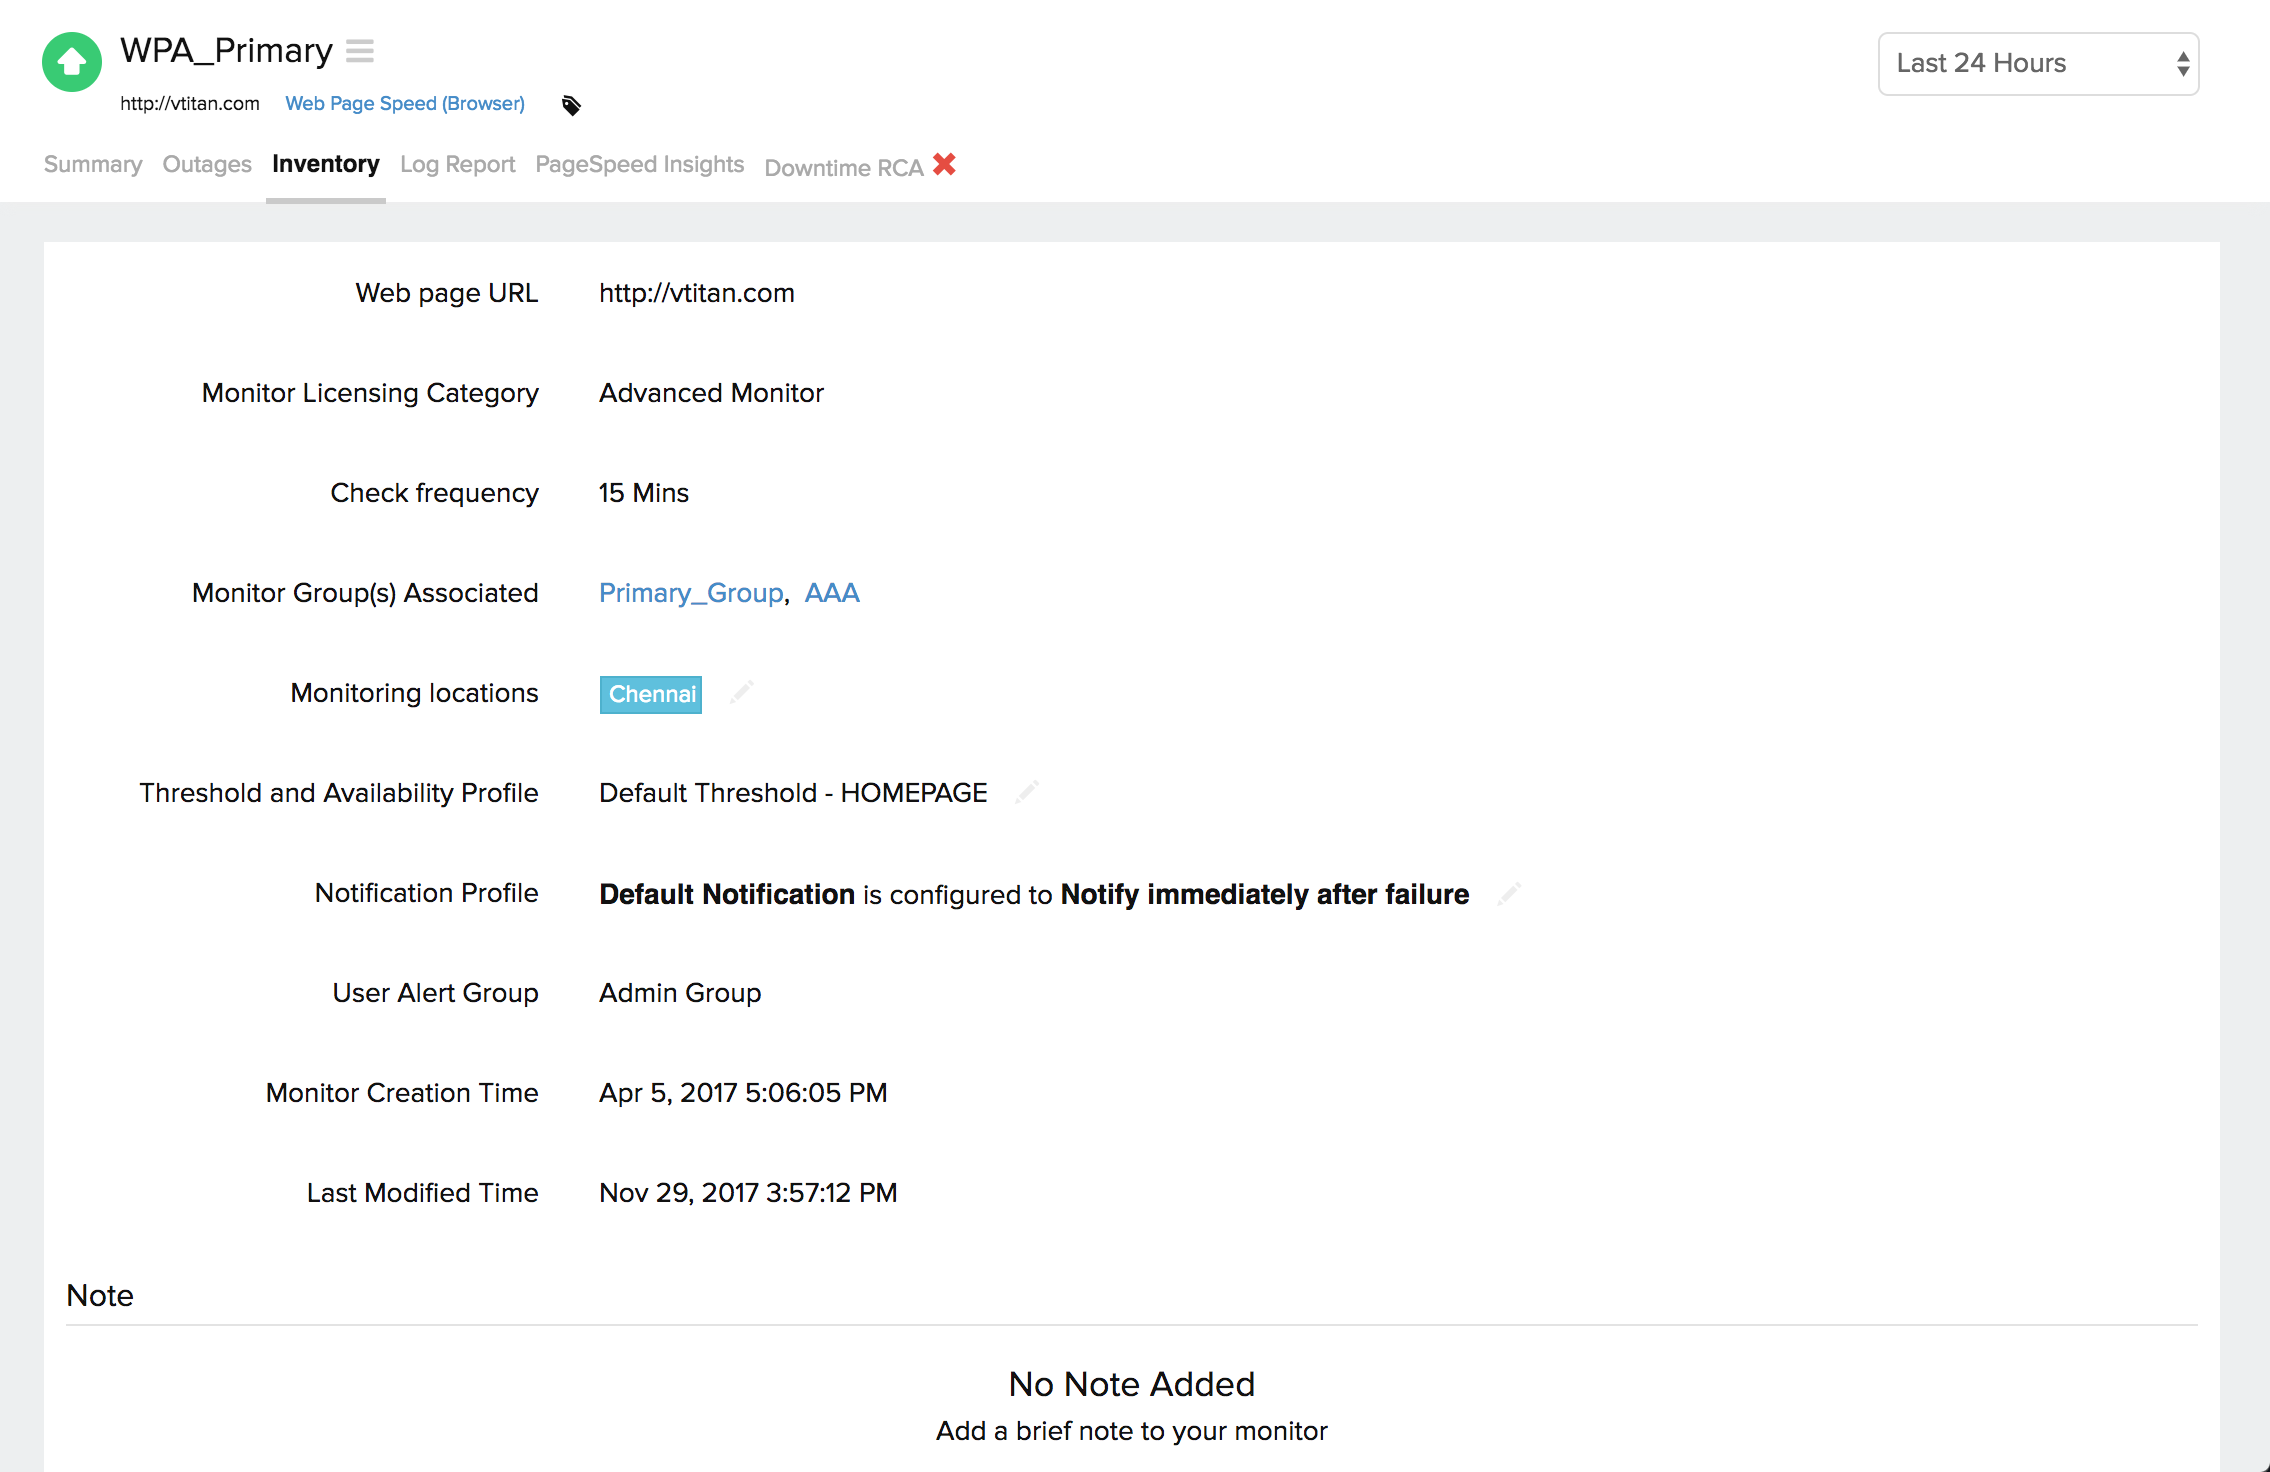
This section captures the basic monitor information and also its various configuration settings including polling locations, poll interval, licensing type, and more.
Log Report:
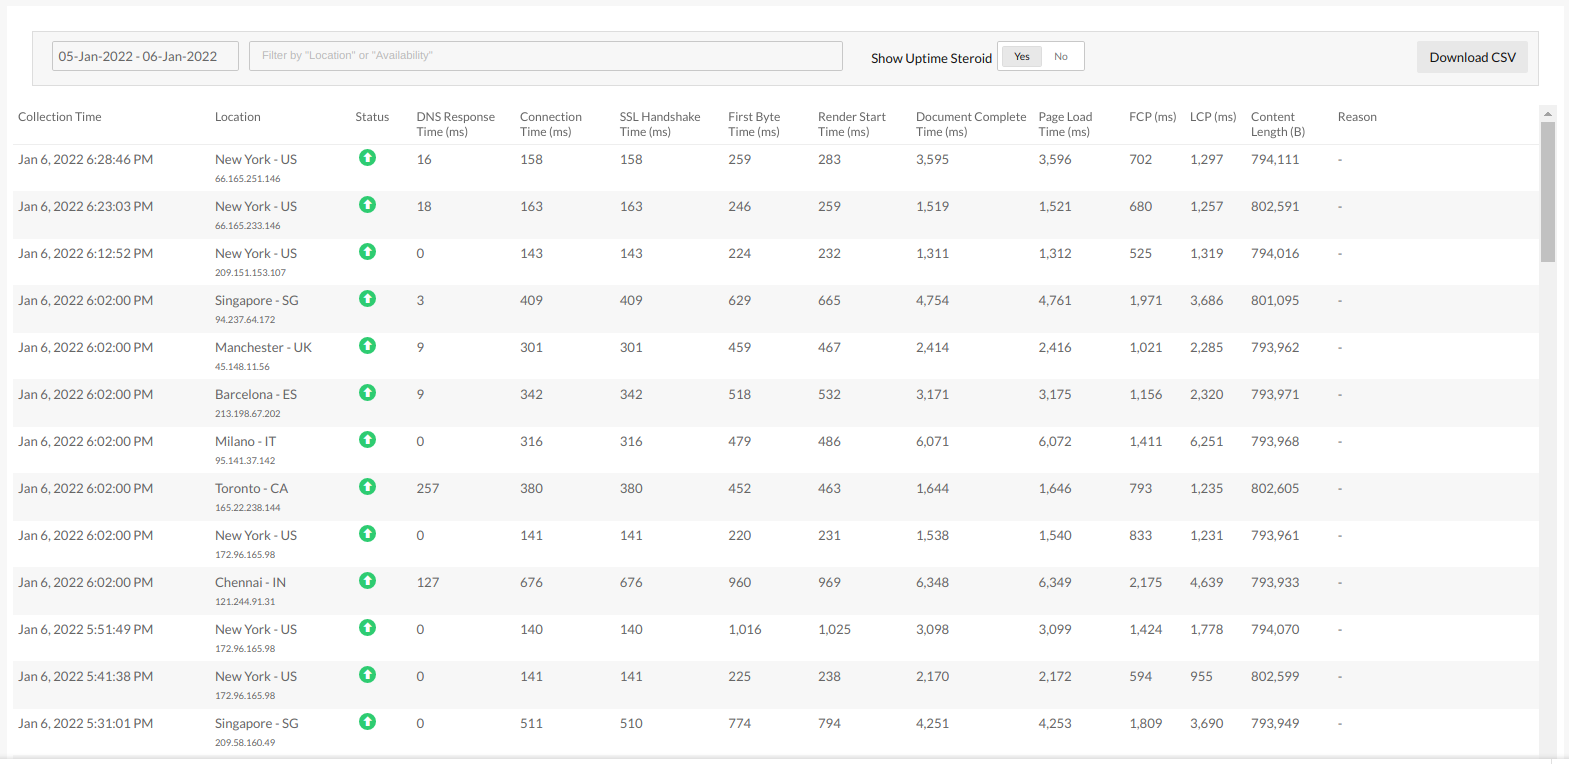
With our integrated log records for individual monitors, you can get an indepth knowledge about the various log details for the configured monitor, over a custom period. You can also filter the log based on location and availability. Various data including availability status, HTTP status codes, DNS response time etc. are captured here. You can also export the log report in CSV format.
Analyze Webpage Speed
Learn more: How to set up a Webpage Speed (Browser)?
