Microsoft SQL Server Insight Monitoring
Gain insight into your Microsoft SQL Server by monitoring the slow queries, top sessions, locks, waits, and expensive queries in real time.
Site24x7's server monitoring integration allows you to set thresholds for different attributes and receive alerts whenever those values exceed the defined limits. By leveraging Site24x7's unique and insightful console, gain a centralized view of your Microsoft SQL server's health and ensure the smooth operation of your Microsoft SQL Server environment.
Setup
Prerequisites
- Ensure AppLogs is enabled. To enable, go to Admin > AppLogs > Settings > Collect application logs from servers using AppLogs > Yes.
- Site24x7 Windows agent version should be 20.6.0 or above.
- .NET version should be 3.0 or above.
- SQL version should be 2008 or above.
The Site24x7 agent needs a few privileges to collect the metrics. You need to provide the Microsoft SQL user with the following limited privileges.
Create a read-only login to connect to your server and grant the required permissions:
CREATE LOGIN site24x7 WITH PASSWORD = '<PASSWORD>';
CREATE USER site24x7 FOR LOGIN site24x7;
GRANT CONNECT ANY DATABASE to site24x7;
GRANT VIEW SERVER STATE to site24x7;
GRANT VIEW ANY DEFINITION to site24x7;
To enable the data collection for failed jobs:
1. For Windows Authentication mode, execute the below T-SQL to provide the necessary permission:
use msdb;
GRANT SELECT TO "NT AUTHORITY\SYSTEM";
2. For SQL Server Authentication mode, execute the below T-SQL with admin privileges. It will add the db_datareader role to the given user.
use msdb;
EXEC sp_addrolemember N'db_datareader', N'user'
Example:
CREATE LOGIN site24x7 WITH PASSWORD = 'localhost@123';
CREATE USER site24x7 FOR LOGIN site24x7;
GRANT VIEW SERVER STATE to site24x7;
GRANT CONNECT ANY DATABASE to site24x7;
GRANT VIEW ANY DEFINITION to site24x7;
use msdb;
EXEC sp_addrolemember N'db_datareader', N'site24x7'
Ensure SQL Server and Windows Authentication Mode is enabled in the SQL server before granting permissions. To enable:
- Open the SQL Management Studio, then right-click the instance to be monitored and select Properties > Security. Under Server Authentication, check SQL Server and Windows Authentication Mode, and click OK.
Adding a Microsoft SQL Server insight monitor
- Log in to Site24x7 and go to Server > Microsoft SQL Server (+).
- Click Download Site24x7 Windows Server Agent. Copy the device key and paste it in the installation wizard when prompted.
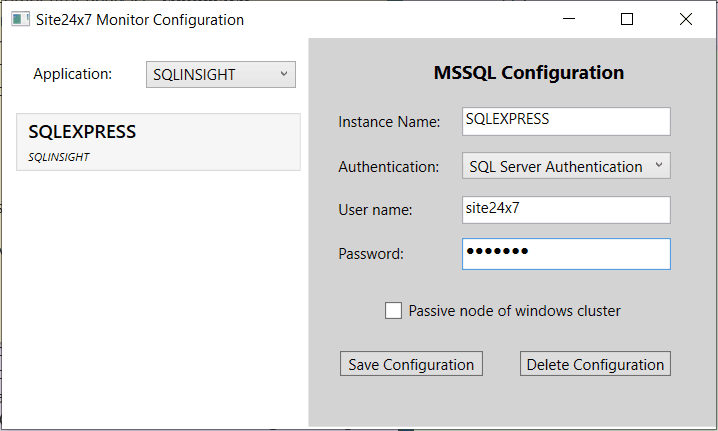
- Once the installation is complete, open the system tray and right-click the Site24x7 tray icon and select App Monitoring Config. Ensure SQL Insight is selected in the Application drop-down, and then select the SQL instance from the left pane.

- Select the authentication mode from the Authentication drop-down. If SQL Authentication is selected, make sure to fill in the required credentials. Then click Save Configuration to complete the configuration.
NoteThus, the SQL instance is configured for monitoring using Site24x7.When monitoring a passive node, make sure to select the checkbox next to Passive node of windows cluster.
To view the monitor, go to Server > Server Monitor > Microsoft SQL Server > select Insights under the SQL instance.
The username and the password you provide will be securely encrypted in the agent and will not be stored in any of the Site24x7 databases.
Uninstall agent
- To uninstall the agent in Windows, go to Start > Settings > Apps > Apps & features.
- Select the Site24x7 Windows agent to remove, and then select More > Uninstall.
You can also use these steps to uninstall using the command line.
Configuring SQL Insight for a MS SQL Failover Cluster setup
If the SQL server belongs to a SQL Failover Cluster setup, follow the prerequisite steps, grant the necessary permissions, and input the credentials for all the nodes (active and passive).
Then, ensure that you selected the checkbox next to the Passive node of windows cluster while configuring the passive nodes of the cluster for monitoring.
Note that one SQL Insight monitor will be added to a SQL cluster setup. When a failover happens, the Site24x7 SQL database monitor will start collecting the insight data of the currently active node.
Supported platforms and versions
- Windows OS platform
- Site24x7 Windows agent version 20.6.0 and above
- .NET version 3.0 and above
- SQL version 2008 and above
Performance metrics
Find the extensive list of essential metrics that can be monitored using our advanced Microsoft SQL Server Insight monitor.
Dashboard
Insight dashboard:
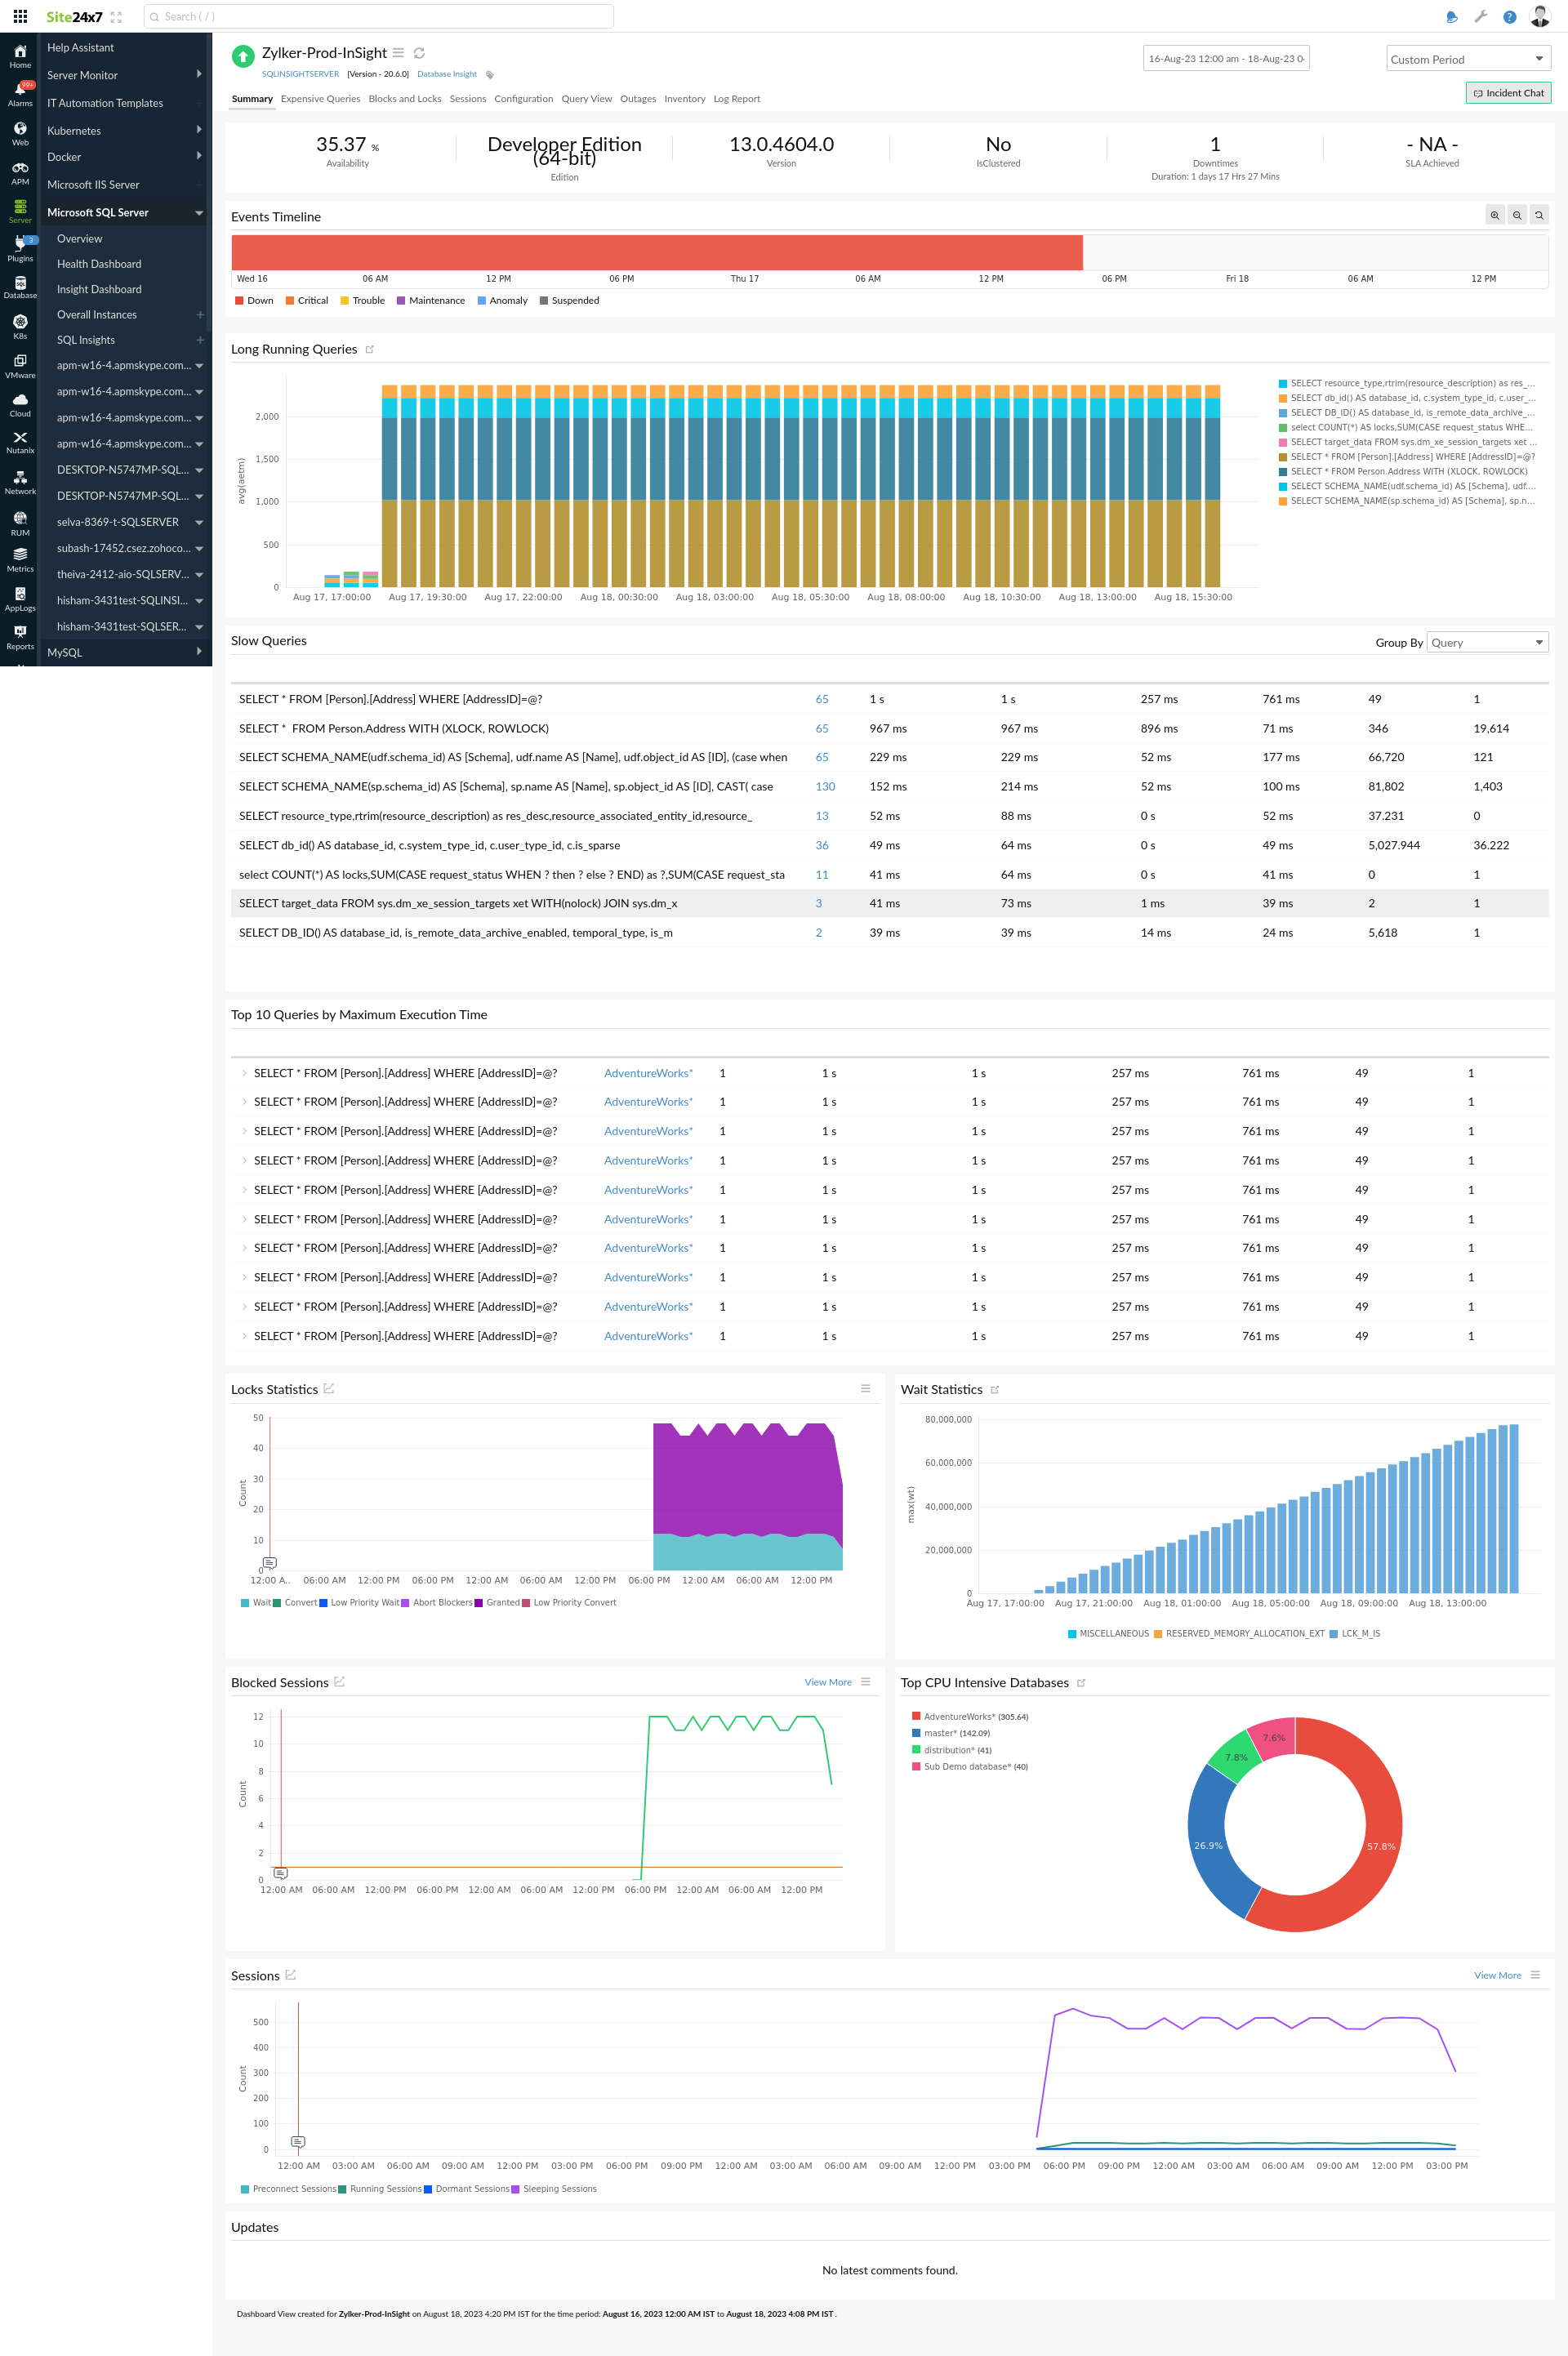
Upon successfully adding the Microsoft SQL Server Insight monitor, you will be automatically directed to the Insight dashboard. Gain valuable insights into high-CPU-consuming queries, slow queries, and input-output (I/O)-intensive queries across all your SQL instances through a comprehensive and unique dashboard.
This Insight dashboard provides a consolidated view of these query metrics, enabling you to easily identify and address any performance issues or disruptions that may arise. By monitoring and analyzing these key query characteristics, you can proactively optimize your SQL environment and ensure efficient performance.
Highlights:
- Obtain a comprehensive view of all Microsoft SQL server queries at a glance.
- Proactively prevent potential performance degradation by analyzing your instances with the highest CPU and memory utilization.

Threshold configuration
After adding the Microsoft SQL monitor to your Site24x7 account, you can add a Threshold and Availability profile to set thresholds and receive alerts when there is a breach.
| Thresholds | Description |
|---|---|
| Sessions | |
| Preconnect Sessions | Get notified with a Trouble, Critical, or Down status when preconnect sessions cross the defined value. |
| Number of Sessions | Get notified with a Trouble, Critical, or Down status when the total number of sessions crosses the configured threshold. |
| Running Sessions | Get notified with a Trouble, Critical, or Down status when the number of running sessions exceeds the configured threshold. |
| Dormant Sessions | Get notified with a Trouble, Critical, or Down status when the total number of dormant sessions crosses the configured value. |
| Sleeping Sessions | Get notified when the total number of sleeping sessions crosses the configured threshold. |
| Blocked Sessions | Get notified when the number of blocked sessions exceeds the configured value. |
| Active Users | Get notified with a Trouble, Critical, or Down status when the number of active users exceeds the defined limit. |
| Locks | |
| Locks | Get notified when the number of locks crosses the configured threshold. |
| Wait | Get notified when the number of waits crosses the configured threshold. |
| Convert | Get notified when the number of converts crosses the configured threshold. |
| Low Priority Wait | Get notified when the number of low priority waits crosses the configured value. |
| Low Priority Convert | Get notified when the number of low priority converts crosses the defined threshold. |
| Abort Blockers | Get notified when the number of abort blocker locks at that moment exceeds the configured threshold. |
| Granted | Get notified when the locks obtained differ from the expected value. |
| Query Parameters | |
| Maximum CPU Time | Get notified when the maximum CPU time consumed during a single execution exceeds the configured threshold. |
| Maximum Execution Time | Get notified when the maximum elapsed time for completed executions crosses the configured threshold. |
| Average CPU Time | Get notified when the average amount of CPU time that was consumed by the executions since it was compiled crosses the configured threshold. |
| Average Execution Time | Get notified when the average elapsed time for the completed executions crosses the configured threshold. |
| Average Logical IO | Get notified when the average I/O of the total number of logical reads and writes performed by the executions crosses the configured threshold. |
| Average Blocked Time | Get notified when the average of the difference between the total elapsed time and the total worker time crosses the defined threshold. |
| Maximum Rows | Get notified when the maximum number of rows ever returned by the query during one execution crosses the configured value. |
| Average Rows | Get notified when the average number of rows returned by the query exceeds the configured threshold. |
IT automation
Site24x7 provides exclusive IT automation templates that enable you to automate remedial actions when there is an outage or threshold breach.
Security
The Site24x7 server monitoring agent never stores your data in the Site24x7 app servers. The username and password are encrypted in the agent for security reasons.
Check out some FAQs on the security aspects of our Microsoft SQL server monitoring:
FAQs:
1. Does Site24x7 need write permission to access databases?
No.
2. What performance data is collected by Site24x7 for monitoring Microsoft SQL servers?
Site24x7 collects data for the performance metrics listed in the document for monitoring Microsoft SQL servers.
3. How do you collect performance metrics for Microsoft SQL monitoring?
Performance metrics are collected by connecting to the Microsoft SQL server with the user credentials given by the user, which has limited read-only access.
4. How do you connect with the Microsoft SQL server?
Site24x7 connects with the Microsoft SQL server with the user credentials given in the terminal console, and collects data.
5. Do you keep the Microsoft SQL connection open?
No. Site24x7 creates a connection to the Microsoft SQL server for collecting performance metrics. Once the data collection is complete, the connection created will be closed.
6. Do you store the Microsoft SQL user password directly?
No. Site24x7 encrypts the password given. The username and password are encrypted in the agent for security reasons. They will not be saved or stored in the Site24x7 app servers.
Licensing
Each Microsoft SQL Server insight consumes one advanced monitor.
