Azure Application Gateway Monitoring Integration
Azure Application Gateway is a web traffic load balancer that helps you manage web application traffic. Additional attributes of an HTTP request, such as the URI path or host headers, can be used by Application Gateway to make routing decisions.
You can now monitor your Application Gateways with accurate metrics, define thresholds, and auto-resolve issues with Site24x7's integration.
Setup and configuration
Adding an Azure Application Gateway while configuring a new Azure monitor
If you haven't configured an Azure Monitor yet, add one by following the steps below:
- Log in to your Site24x7 account.
- Choose Cloud from the left navigation pane, select Azure > Add Azure Monitor. You can also follow these steps to add an Azure Monitor.
- During Azure monitor configuration, in the Edit Azure Monitor page, select Azure Application Gateway from the Service/Resource Types drop-down.
Adding an Azure Application Gateway to an existing Azure monitor
If you already have an Azure monitor configured for the tenant, you can add the Azure Application Gateway by using the following steps:
- Log in to your Site24x7 account.
- Navigate to the Infrastructure/Inventory/Management Dashboards from the left pane of the Azure monitor for which you wish to add an Azure application gateway.
- Click this
 icon and then Edit, which will bring you to the Edit Azure Monitor page.
 - In the Edit Azure Monitor page, select the corresponding Subscription and Resource Group from the drop-down menu, select Azure Application Gateway from the Service/Resource Types drop-down, and click Save.
After successful configuration, go to Cloud > Azure, select Azure Application Gateway from the Azure monitor drop-down. Now you can view the discovered application gateways.
It will take 15-30 minutes to discover new Azure resources. For immediate discovery of the selected configuration, go to the Infrastructure Dashboard of the Azure monitor and click on Discover Now from this ![]() icon.
icon.
Polling frequency
Site24x7's Azure Application Gateway Monitor collects metric data every minute and the statuses from your application gateways every five minutes.
Supported metrics
Azure Application Gateway allows users to choose a tier during the setup process. The tiers are:
Each tier will have its respective metrics. Site24x7 displays the metrics applicable to the tier selected by the user and some of the metrics not applicable to your tier may appear empty.
The following metrics are collected:
| Metric name | Description | Statistic | Unit |
|---|---|---|---|
| Standard V2 | |||
| Throughput | The number of bytes per second the Application Gateway has served. | Average | Bytes per second |
| Unhealthy Host Count | The number of unhealthy backend hosts. | Average | Count |
| Healthy Host Count | The number of healthy backend hosts. | Average | Count |
| Total Requests | The number of successful requests that the Application Gateway has served. | Total | Count |
| Requests per minute per Healthy Host | The average number of requests per minute per healthy backend host in a pool. | Average | Count per minute |
| Failed Requests | The number of failed requests that the Application Gateway has served. | Average | Count |
| Response Status | HTTP response status returned by the Application Gateway. | Total | Count |
| Current Connections | The number of current connections established with Application Gateway. | Average | Count |
| New connections per second | New connections per second established with the Application Gateway. | Average | Count per second |
| Current Capacity Units | Capacity Units consumed. | Average | Count |
| Current Capacity Units | Capacity Units consumed. | Average | Count |
| Fixed Billable Current Capacity Units | Fixed Capacity Units consumed. | Average | Count |
| Estimated Billed Current Capacity Units | Estimated Capacity Units consumed. | Average | Count |
| Current Compute Units | Compute Units consumed. | Average | Count |
| Backend Response Status | The number of HTTP response codes generated by the backend members. This does not include any response codes generated by the Application Gateway. | Average | Count |
| Client TLS Protocol | The number of TLS and non-TLS requests initiated by the client that established connection with the Application Gateway. | Total | Count |
| Bytes Sent | The total number of bytes sent by the Application Gateway to the clients. | Total | Count |
| Bytes Received | The total number of bytes received by the Application Gateway from the clients. | Total | Count |
| Client RTT | Round trip time between clients and the Application Gateway. | Average | Milliseconds |
| Application Gateway Total Time | Time taken to process a request and send a response. | Average | Milliseconds |
| Backend Connect Time | Time spent establishing a connection with a backend server. | Average | Milliseconds |
| Backend First Byte Response Time | Time between the start of connection establishment and the reception of the first byte of data. | Average | Milliseconds |
| Backend Last Byte Response Time | Time interval between start of establishing a connection to the backend server and receiving the last byte of the response body. | Average | Milliseconds |
| WAF V2 | |||
| Throughput | The number of bytes per second the Application Gateway has served. | Average | Bytes per second |
| Unhealthy Host Count | The number of unhealthy backend hosts. | Average | Count |
| Healthy Host Count | The number of healthy backend hosts. | Average | Count |
| Total Requests | Count of successful requests that the Application Gateway has served. | Total | Count |
| Requests per minute per Healthy Host | The average number of requests per minute per healthy backend host in a pool. | Average | Count |
| Failed Requests | The number of failed requests that the Application Gateway has served. | Average | Count |
| Response Status | HTTP response status returned by the Application Gateway. | Total | Count |
| Current Connections | The number of current connections established with the Application Gateway. | Total | Count |
| New connections per second | New connections per second established with the Application Gateway. | Average | Count per second |
| Current Capacity Units | Capacity Units consumed. | Average | Count |
| Fixed Billable Current Capacity Units | Fixed Capacity Units consumed. | Average | Count |
| EstimatedBilledCurrent Capacity Units | Estimated Capacity Units consumed. | Average | Count |
| Current Compute Units | Compute Units consumed. | Average | Count |
| Backend Response Status | The number of HTTP response codes generated by the backend members. This does not include any response codes generated by the Application Gateway. | Average | Count |
| Client TLS Protocol | The number of TLS and non-TLS requests initiated by the client that established connection with the Application Gateway. | Total | Count |
| Bytes Sent | The total number of bytes sent by the Application Gateway to the clients. | Total | Bytes |
| Bytes Received | The total number of bytes received by the Application Gateway from the clients. | Total | Bytes |
| Client RTT | Round trip time between clients and Application Gateway. | Average | Milliseconds |
| Application Gateway Total Time | Time taken to process a request and send a response. | Average | Milliseconds |
| Backend Connect Time | Time spent establishing a connection with a backend server. | Average | Milliseconds |
| Backend First Byte Response Time | Time between the start of connection establishment and the reception of the first byte of data. | Average | Milliseconds |
| Backend Last Byte Response Time | Time interval between start of establishing a connection to the backend server and receiving the last byte of the response body. | Average | Milliseconds |
| WAF Total Requests | Total number of requests evaluated by WAF. | Total | Count |
| WAF Custom Rule Matches | Matched Custom Rules. | Average | Count |
| WAF Managed Rule Matches | Matched Managed Rules. | Average | Count |
| WAF Bot Protection Matches | Matched Bot Rules. | Average | Count |
| Standard | |||
| Throughput | The number of bytes per second the Application Gateway has served. | Average | Bytes per second |
| Unhealthy Host Count | The number of unhealthy backend hosts. | Average | Count |
| Healthy Host Count | The number of healthy backend hosts. | Average | Count |
| Total Requests | The number of successful requests that the Application Gateway has served. | Total | Count |
| Requests per minute per Healthy Host | The number of average requests per minute per healthy backend host in a pool. | Average | Count |
| Failed Requests | The number of failed requests that Application Gateway has served. | Total | Count |
| Response Status | HTTP response status returned by the Application Gateway. | Total | Count |
| Current Connections | The number of current connections established with Application Gateway. | Total | Count |
| CPU Utilization | Current CPU utilization of the Application Gateway. | Average | Percent |
| WAF | |||
| Throughput | The number of bytes per second the Application Gateway has served. | Average | Bytes per second |
| Unhealthy Host Count | The number of unhealthy backend hosts. | Average | Count |
| Healthy Host Count | The number of healthy backend hosts. | Average | Count |
| Total Requests | The number of successful requests that Application Gateway has served. | Total | Count |
| Requests per minute per Healthy Host | The average number of requests per minute per healthy backend host in a pool. | Average | Count per minute |
| Failed Requests | Count of failed requests that Application Gateway has served. | Total | Count |
| Response Status | HTTP response status returned by the Application Gateway. | Total | Count |
| Current Connections | Count of current connections established with the Application Gateway. | Total | Count |
| CPU Utilization | Current CPU utilization of the Application Gateway. | Average | Percent |
| WAF Total Rule Distribution | Web Application Firewall Total Rule Distribution for the incoming traffic. | Total | Count |
| WAF Blocked Count | Total number of Web Application Firewall requests blocked. | Total | Count |
| WAF Blocked Requests Rule Distribution | TotalCount | ||
Threshold configuration
Global configuration
- Go to the Admin section on the left navigation pane.
- Select Configuration Profiles from the left pane and choose the Threshold and Availability (+) tab from the drop-down menu.
- Choose the monitor type as Azure Application Gateway.
You can also set the threshold values for all the metrics mentioned above.
Monitor-level configuration
- Go to Cloud > Azure and select Azure Application Gateway from the drop-down menu.
- Choose a resource for which you would like to set a threshold and then click this
 icon on the top. Choose the Edit option, which directs you to the Edit Azure Application Gateway Monitor page.
You can set the threshold values for the metrics by selecting the Threshold and Availability option. You can also configure IT automation at the attribute level.
IT Automation
Site24x7's IT automation tools help auto-resolve performance degradation. The alarm engine continually evaluates the system events for which thresholds are set, and executes the mapped automation when there is a breach.
How to configure IT automation for a monitor.
Configuration Rules
Configure Threshold Profile, Notification Profile, Tags, Monitor Group, and other parameters for multiple monitors with Site24x7's Configuration Rules. You can run a scan and associate any of the previously generated rules that suit the monitor configurations while adding new monitors.
How to add a configuration rule.
Summary
The Summary tab will give you the performance data organized by time for the above mentioned metrics.
- To view the summary, go to Cloud > Azure and click the Azure monitor > Azure Application Gateway.
- Click a resource and select the Summary tab.
By doing so, you can view the Healthy Host count, Throughput, Total Requests, and much more.
Configuration Details
The Configuration Details of an application instance are provided under this tab. Here, you'll find the Pricing Tier, Operational State, IP Configurations, HTTP Port Configurations and so on.
- To get the configuration details, go to Cloud > Azure and click the Azure monitor > Azure Application Gateway.
- Click a resource and select the Configuration Details tab.
Reports
Gain in-depth data about the various parameters of your monitored resources and accentuate your service performance using our insightful reports.
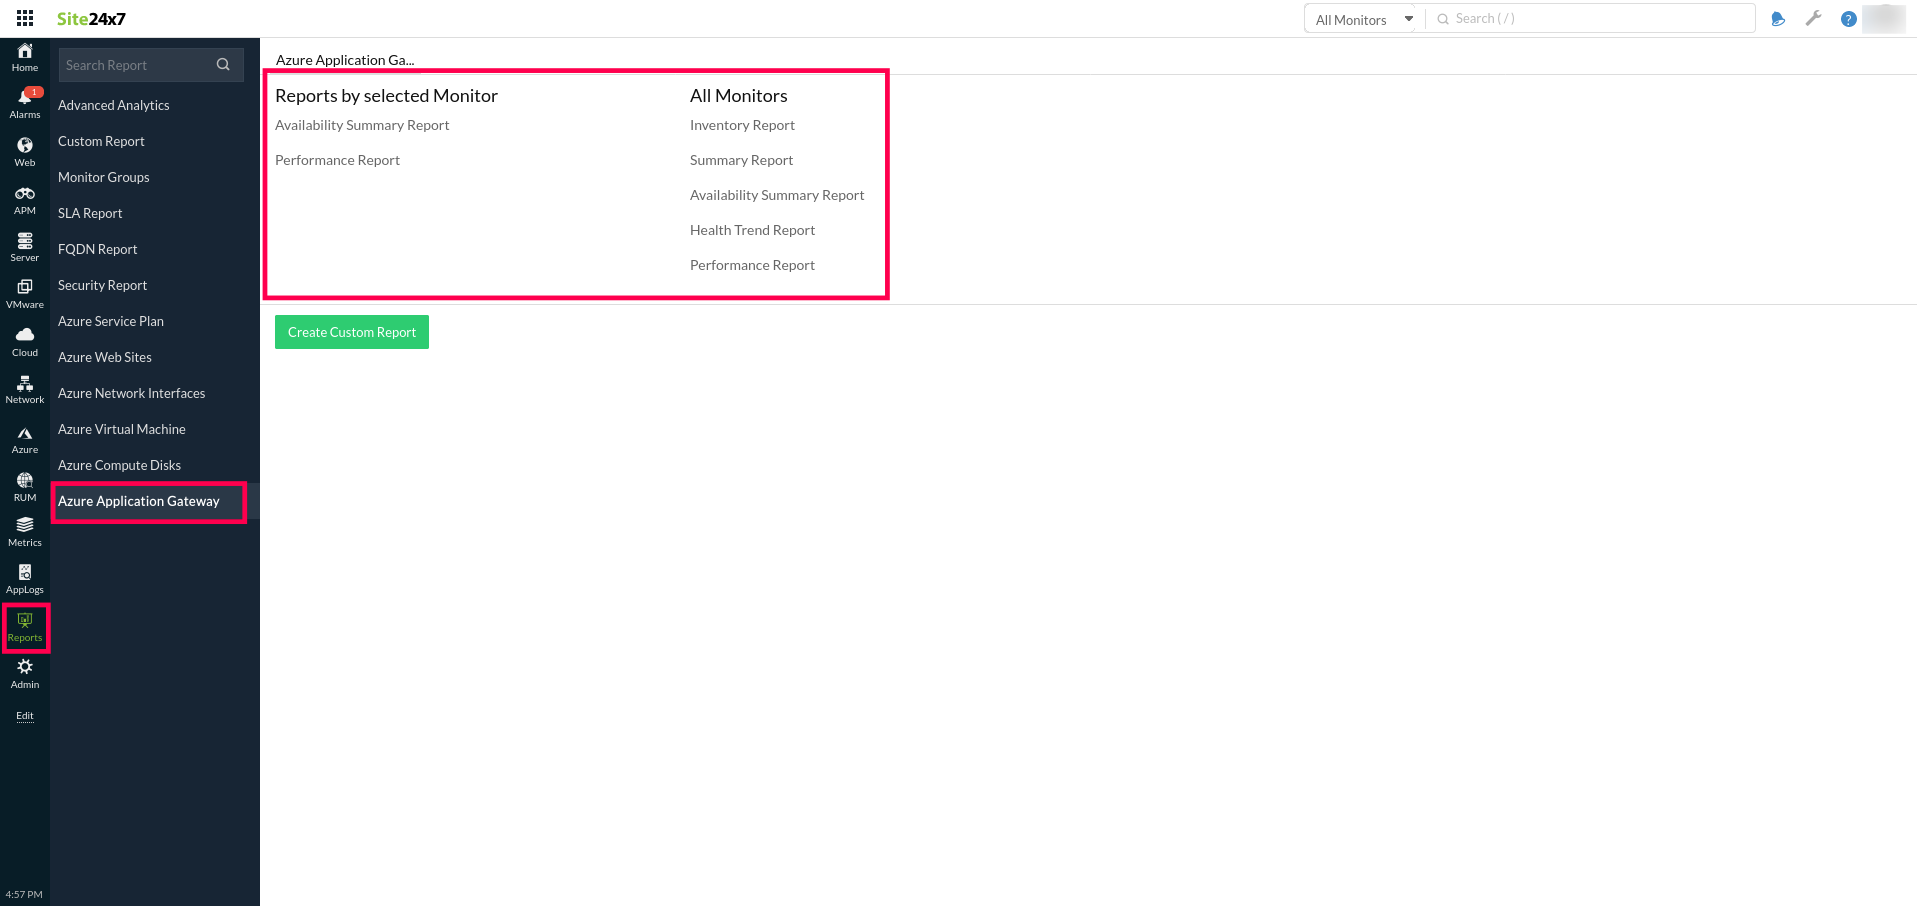
To view reports for Azure Application Gateways:
- Navigate to the Reports section on the left navigation pane.
- Select Azure Application Gateway from the menu on the left.
You can find the Availability Summary Report and the Performance Report for one selected monitor, or you can get the Inventory Report, Summary Report, Availability Summary Report, Health Trend Report, and the Performance Report for all the application gateway monitors.

You can also get reports from the Summary tab of the Azure Application Gateway Monitor.
- Go to the Summary tab of the Azure Application Gateway Monitor, and get the Availability Summary Report of the monitor by clicking on Availability or Downtime.
You can also find the Performance Report of the monitor by clicking on any chart title.
Site24x7's Application Gateway monitoring interface
Get an overview of the availability and usage status of your Application Gateway.
Summary
The Summary tab will help you view the Healthy Host count, Total Requests, and Throughput related information.
Configuration Details
The Configuration Details tab provides the configuration details of your Application Gateway. Details on the Pricing Tier, Operational State, IP Configurations, HTTP Port Configurations, and many more are included in this section.
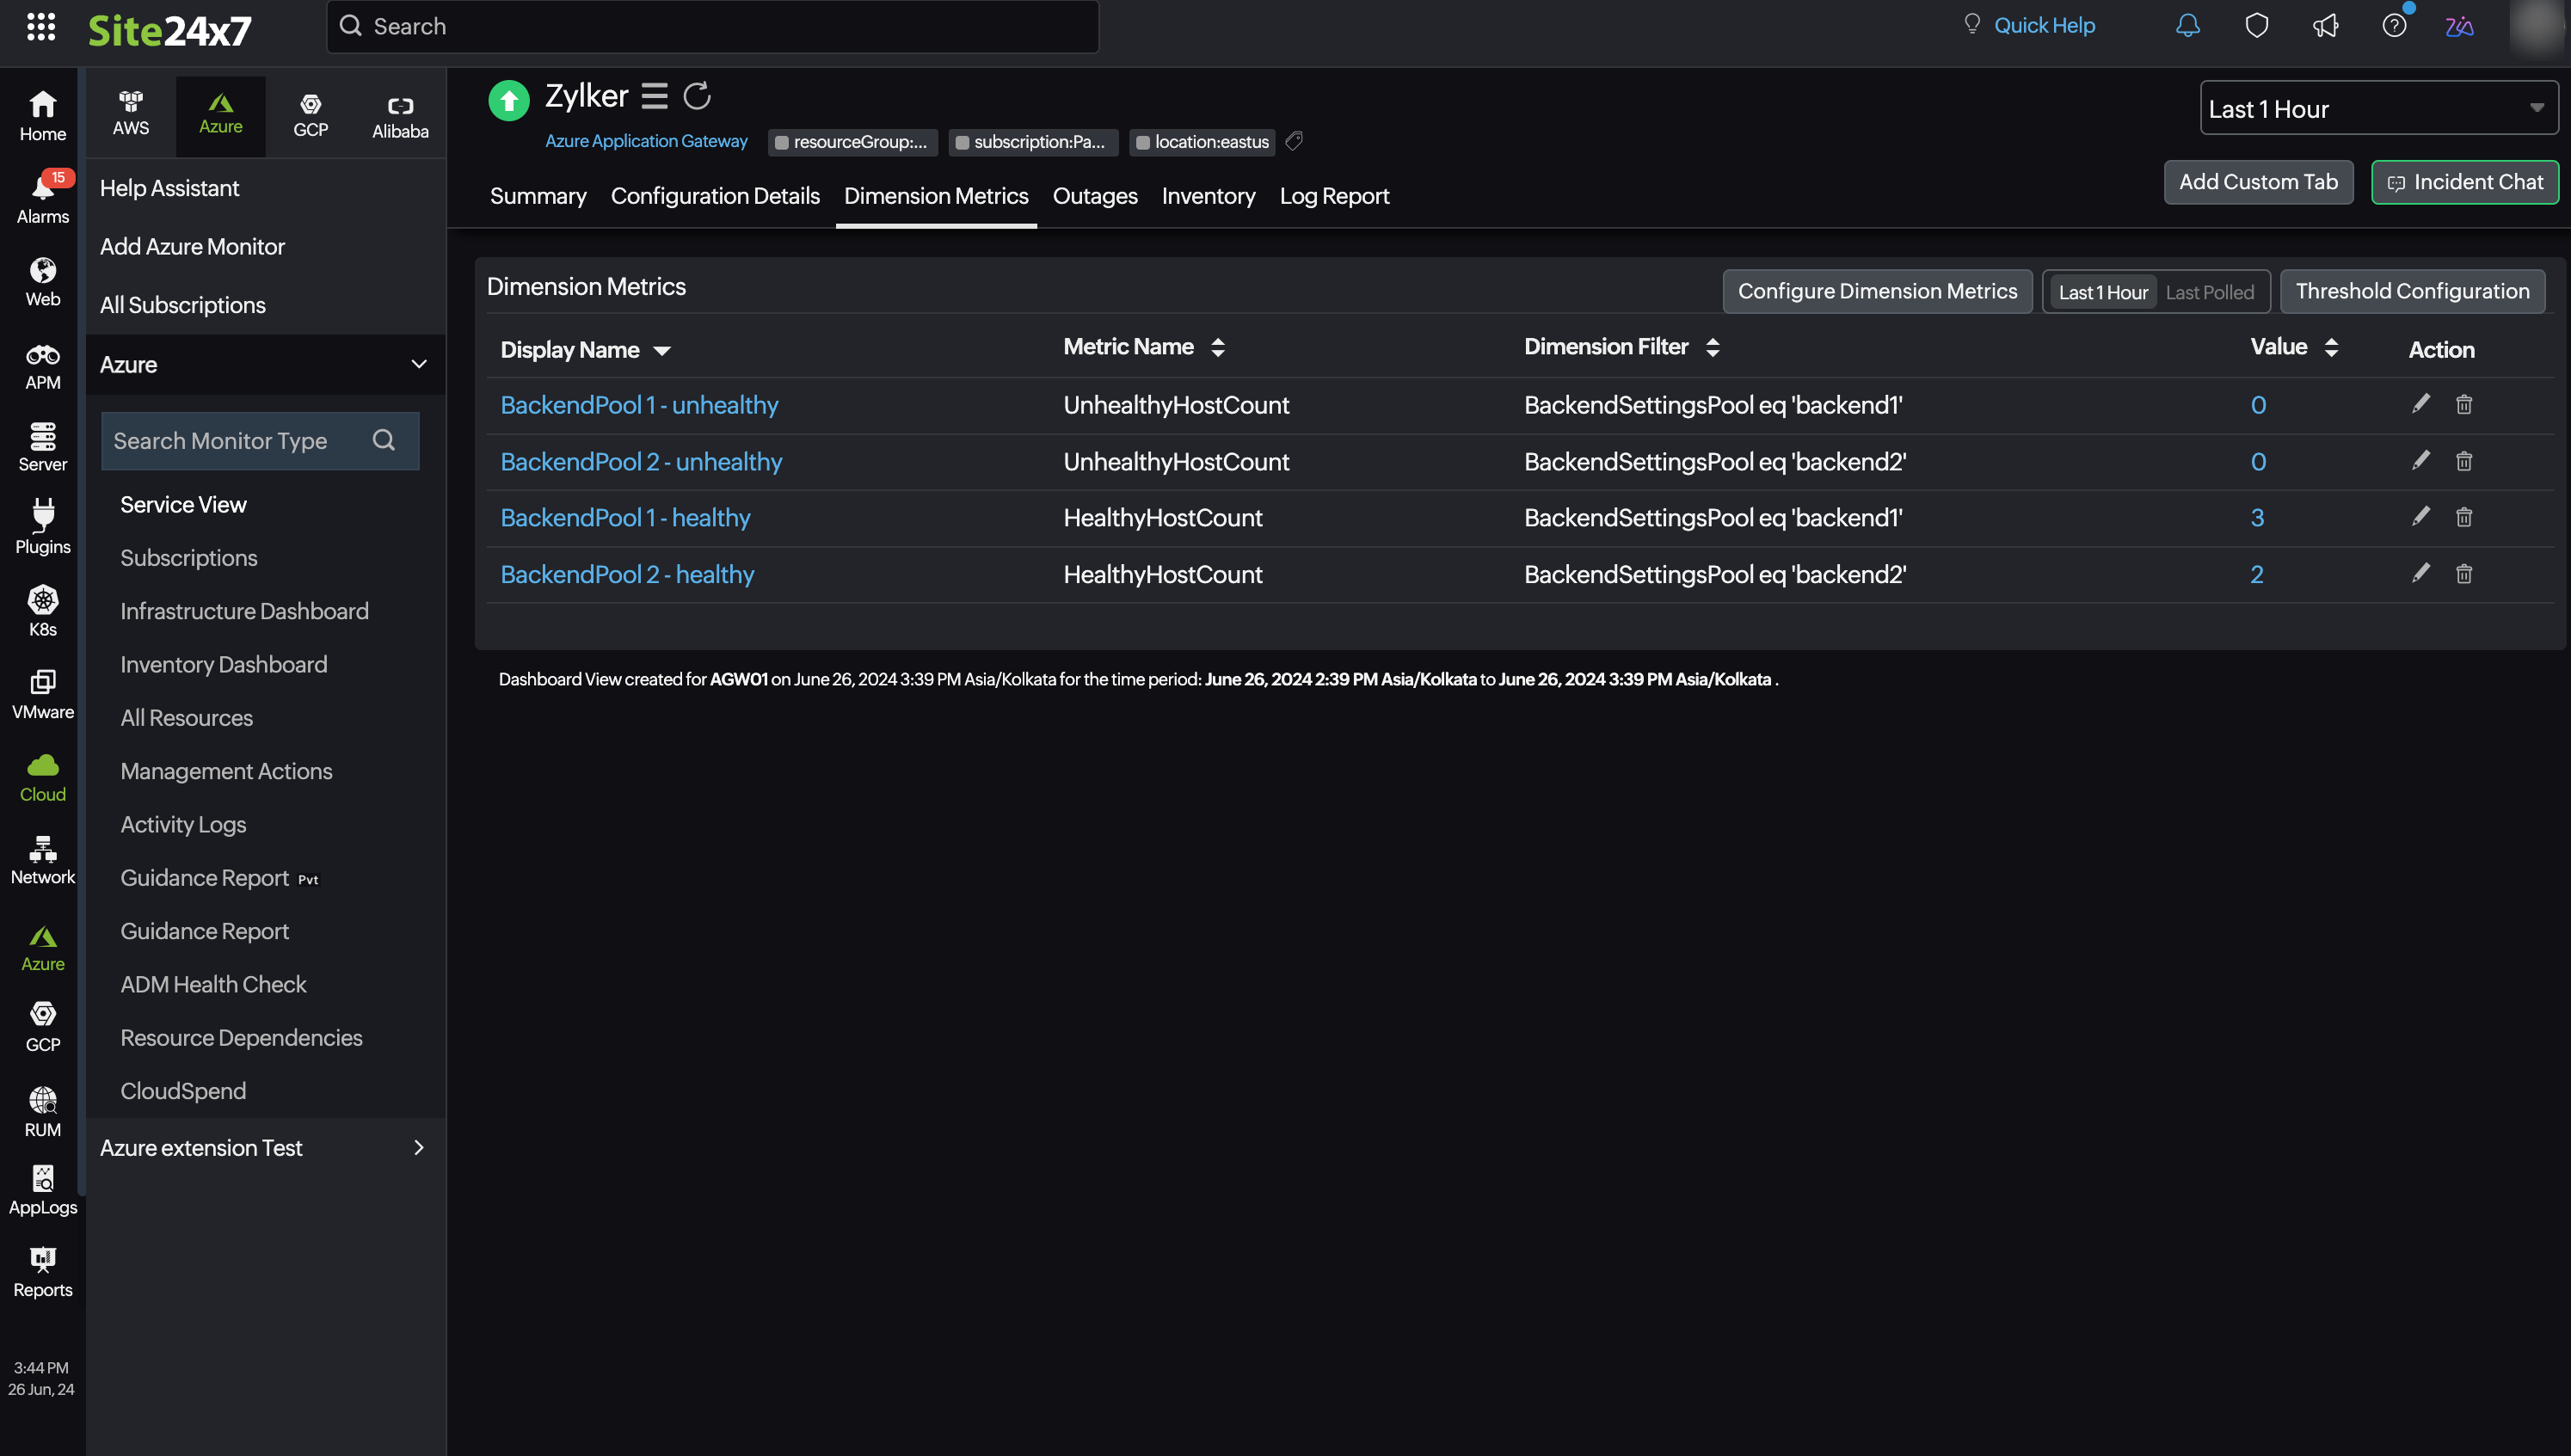
Dimension Metrics
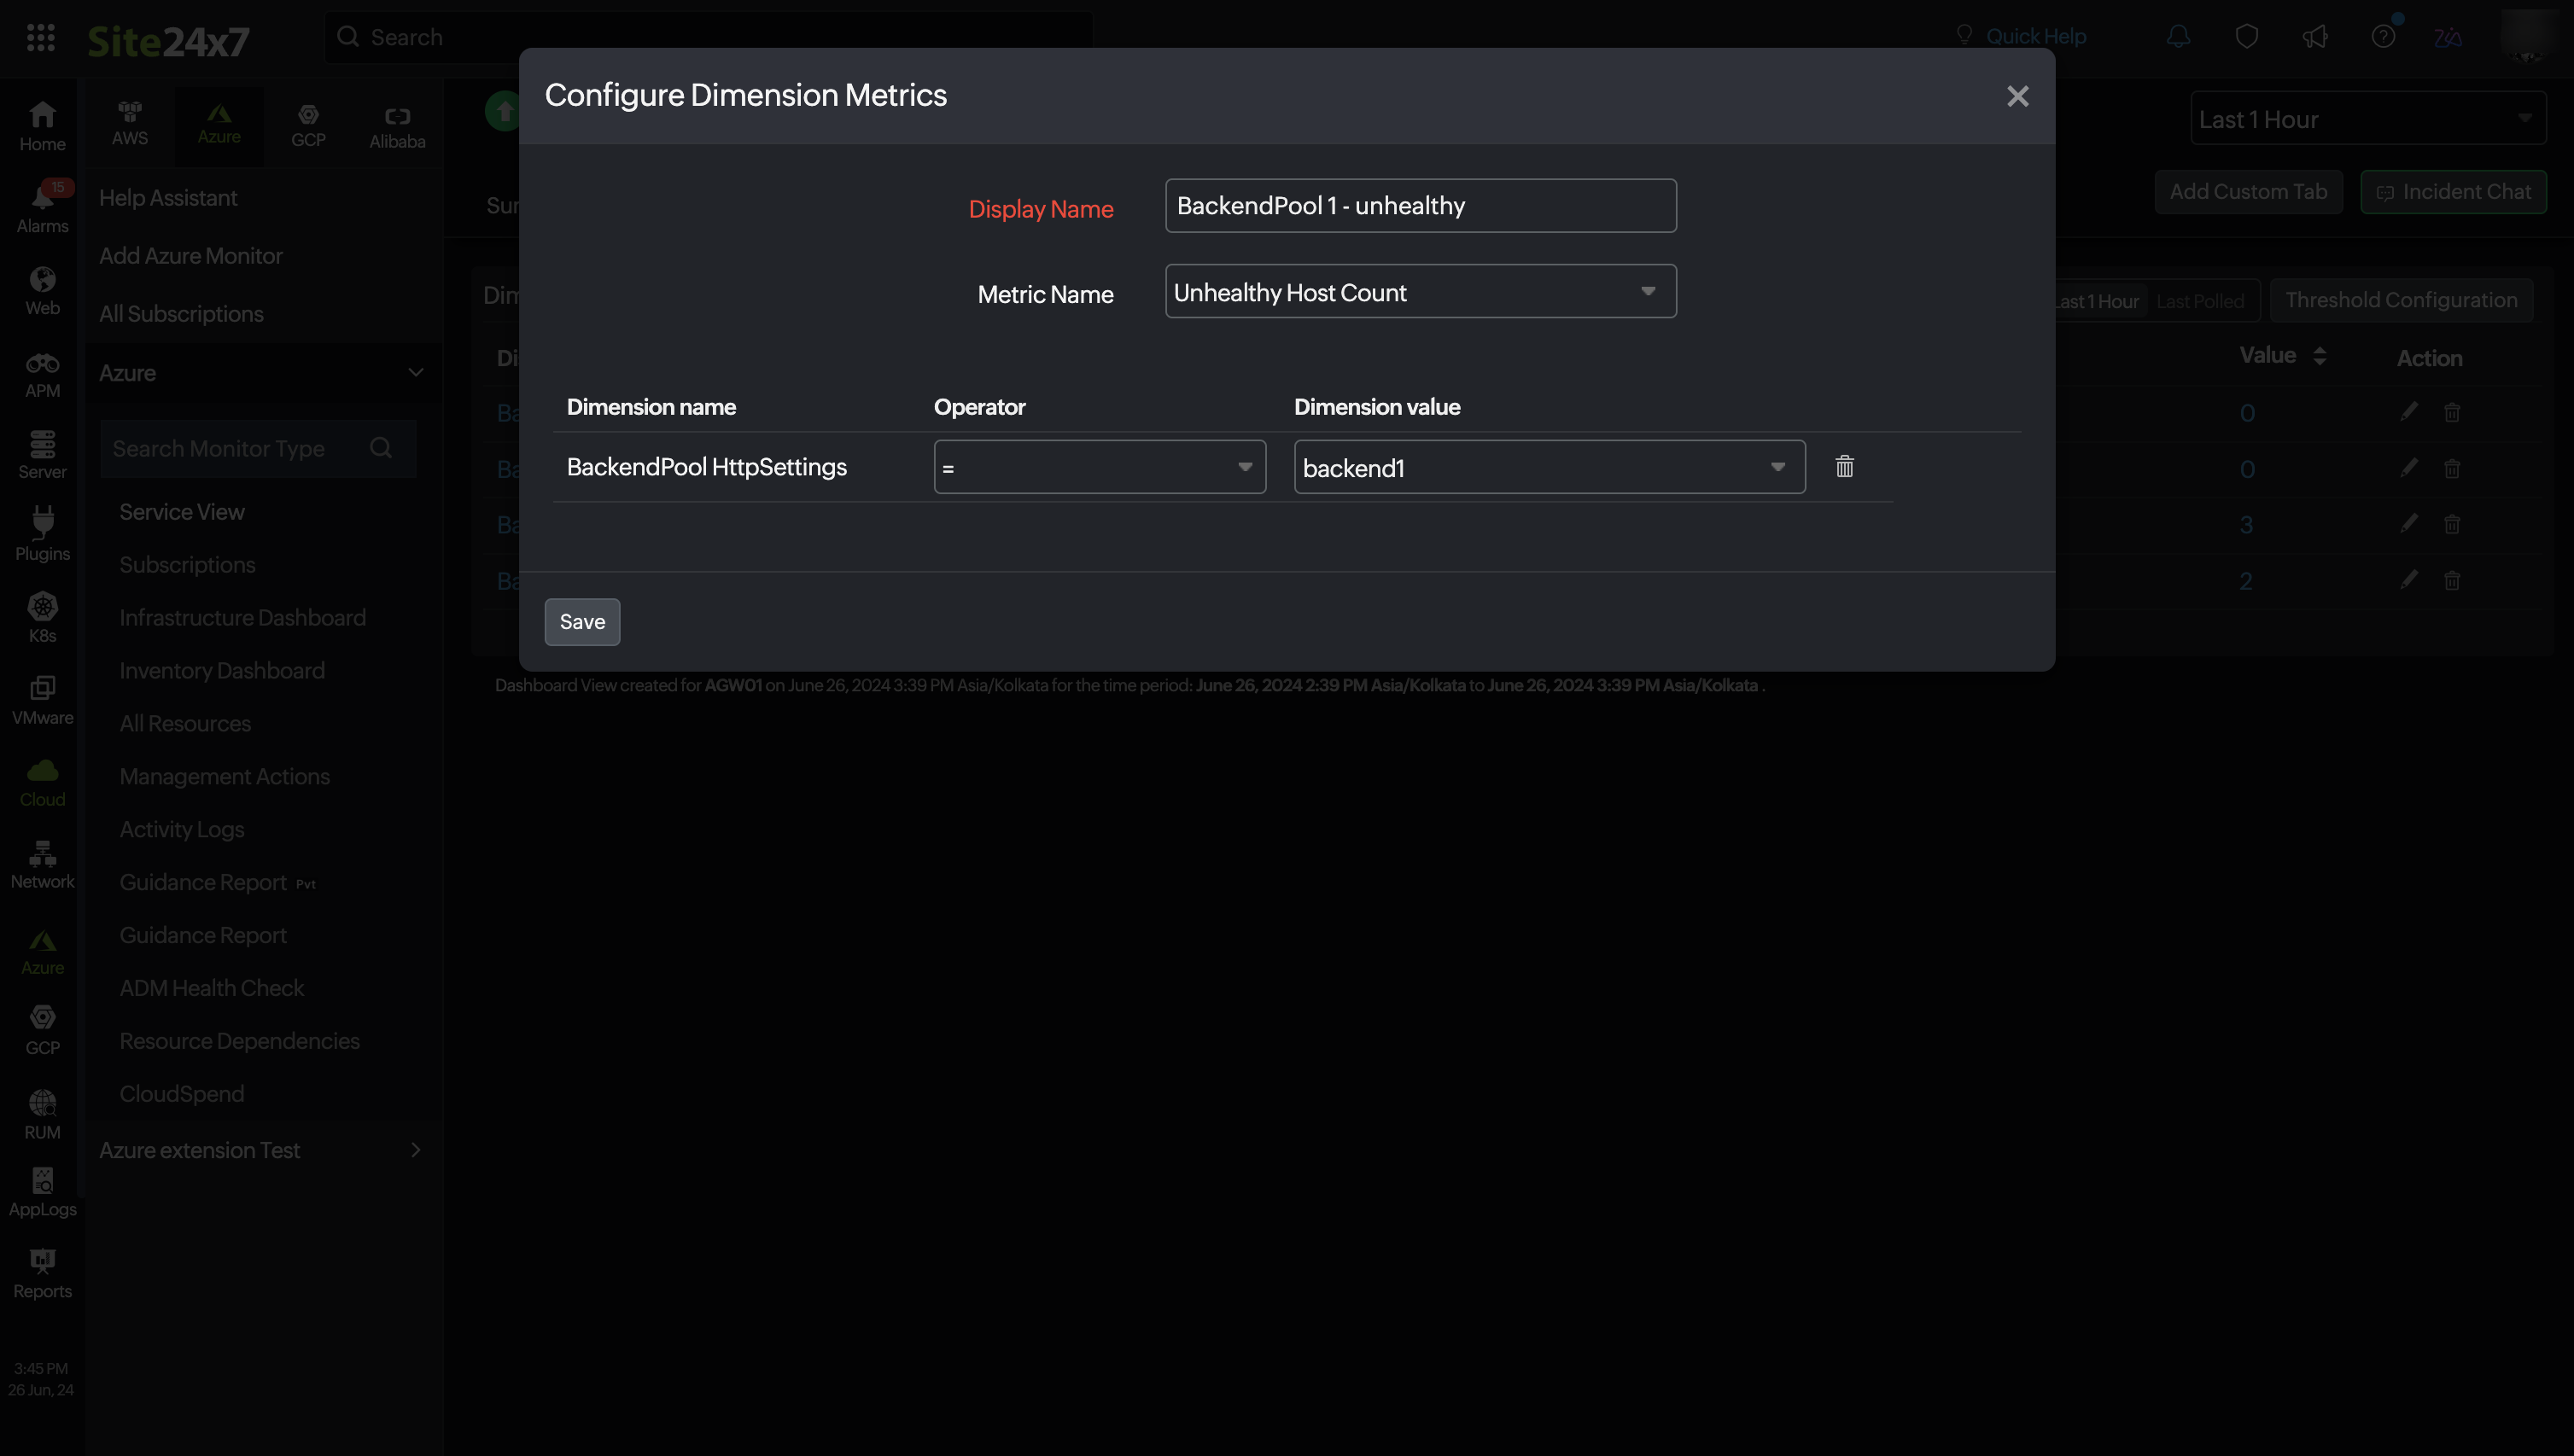
Configure Dimension Metrics to view the dimension metric information. Get alerts by applying the respective dimension filter and configuring thresholds for them. You can apply thresholds in bulk for the metrics. Edit and delete the monitored dimension metrics using the Action option. You can monitor up to 10 dimension metrics.


Outages
The Outages tab provides the history of the Application Gateway statuses, including Down, Trouble, and Critical.
Inventory
The Inventory tab provides the licensing details, the Threshold and Availability Profiles, the Notification Profiles set, the set User Alert Group, and the monitor created time and modified time.
Log Report
The Log Report tab lists all the logs collected during every data collection, along with their statuses.
Related links
How to add an Azure monitor.
How to integrate Azure Virtual Machine monitor.
How to integrate Azure Network Interface monitor.
How to integrate an Azure App Service monitor.
How to configure IT automations for a monitor.
