Capturing RUM Metrics
Real User Monitoring Technical Documentation
The following document explains how Site24x7 RUM script works, metrics captured and their calculation.
The script provided to you downloads the beacon file(site24x7rum.js) asynchronously. Beacon file contains the code to capture the page metrics. For calculating the page load metrics we are using Navigation Timing API - This specification defines an interface for web applications to access timing information related to navigation and elements. Every 5 seconds the collected metrics are sent to server.
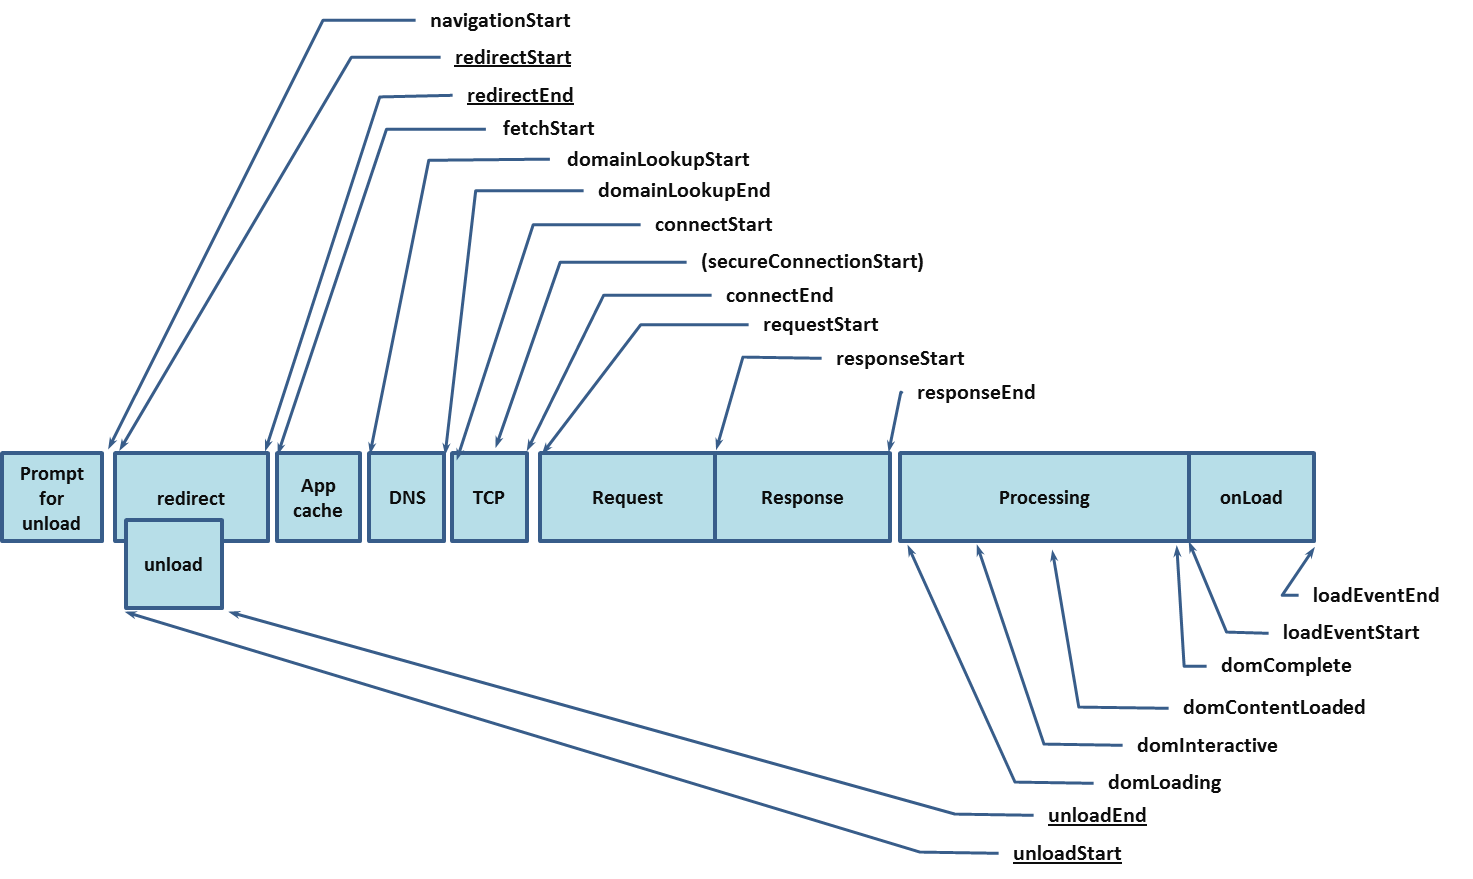
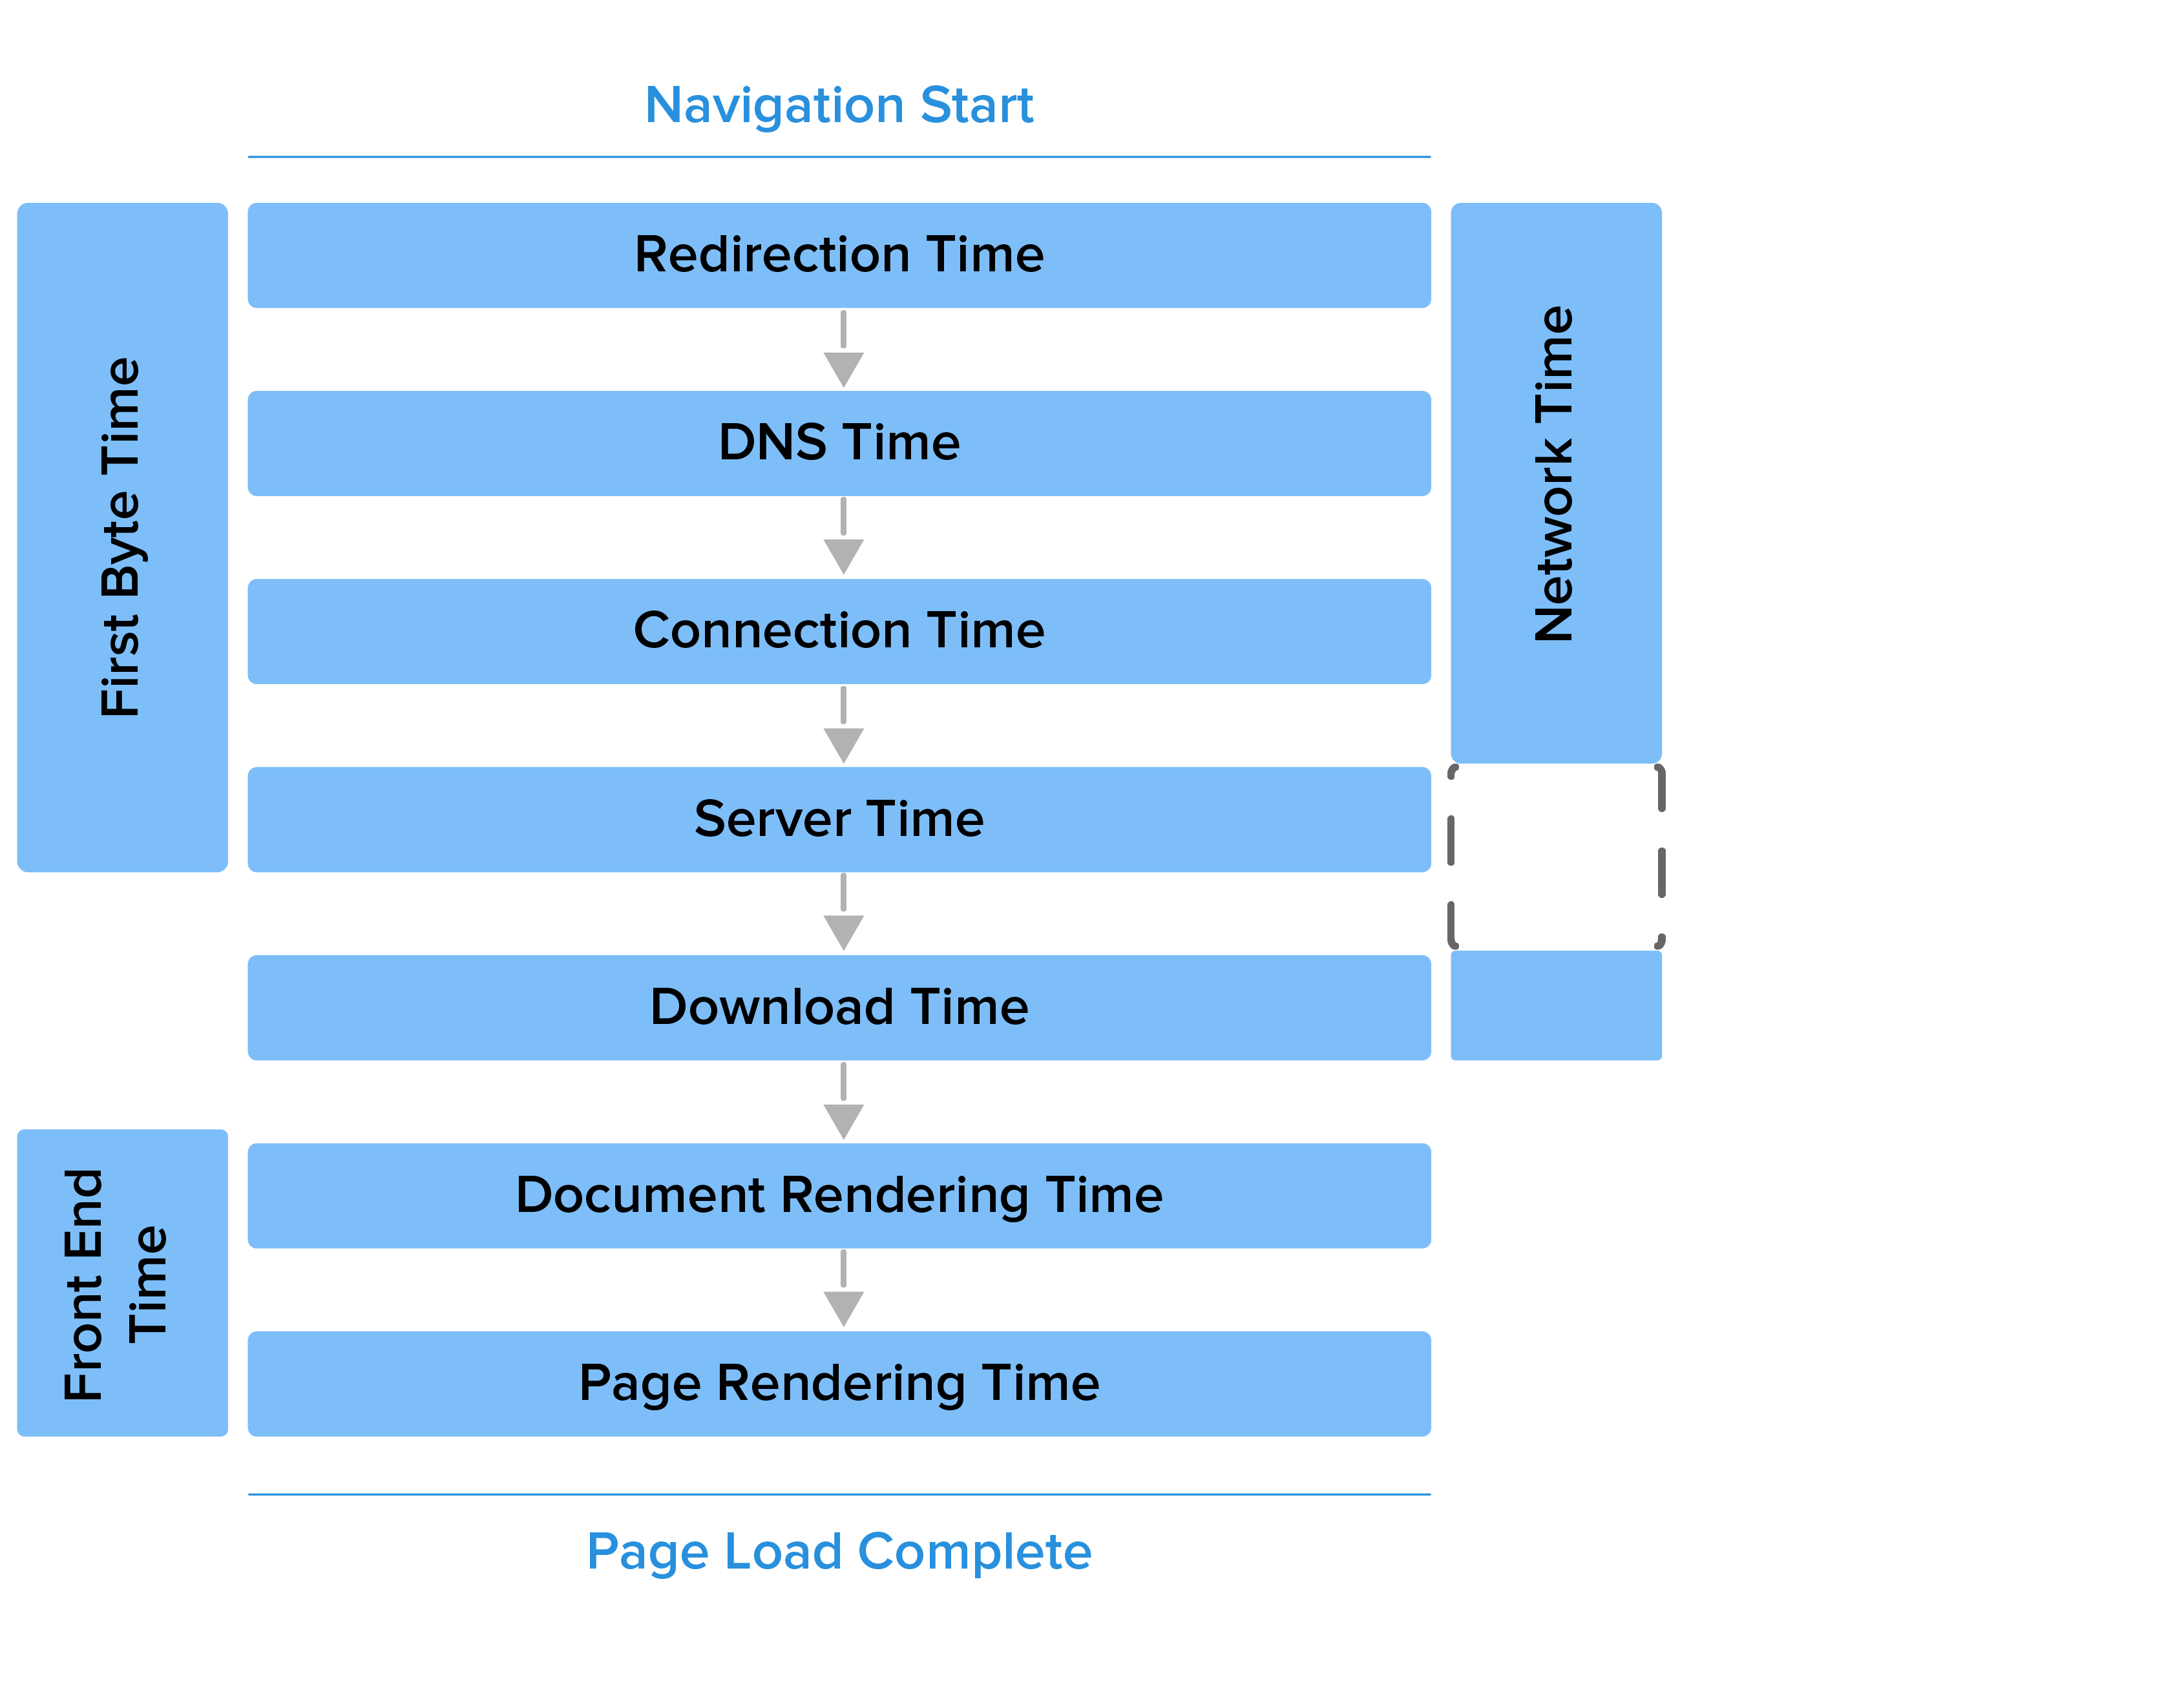
After a page is loaded , ' load' event is fired in browser. We listen to that load event and then required page metrics like redirection time, dns time connection time, network time, backend time and frontend time are calculated from the performance timing object of that page. For calculating the above metrics we use the attributes defined by the Performance Timing interface:
For Example:
redirection time = performanceObj.redirectStart - performanceObj.redirectEnd

Ajax Calls
To get the ajax calls information we listen to XMLHttpRequest.prototype.open and collect the ajax calls.
Javascript Errors
We are capturing javascript errors by listening to window.onerror event that is fired when javascript error is thrown.
window.onerror = function( message, url, lineNo, columnNo, error) {
// code to send captured error
}
Metrics and calculation:
The following section explains the metrics captured, its calculation and importance.

Redirection Time
Redirection Time = redirectEnd - redirectStart
Redirect time measures the amount of time it takes a request to follow a redirect. If there are no redirects, the redirection time is expected to be 0. In case of cached resources, redirection time corresponds to the time taken for application cache lookup.
DNS Time
DNS Time = domainLookupEnd - domainLookupStart
DNS time measures the amount of time to complete a domain lookup for the requested resource. In case of cached resources and cached DNS records, the DNS time is expected to be 0.
DNS time provides the webmasters/devOps insights as to how much improvements can be made by minimizing the number of cross-origin resources loaded for a given page.
Connection Time
Connection Time = connectEnd - connectStart
Connection time measures the amount of time to establish a transport connection and perform SSL authentication.
Connection time also includes the blocked/stalled time that is taken up due to too many concurrent requests issued by the browser. Effective uses of browser caching and the HTTP Keep-Alive header can greatly reduce the impact of connection time.
Server Time
Server Time = responseStart - requestStart
Server time measures the amount of time taken by the application backend to serve the requested resource.
An increase in server time might be a result of your application servers handling excess traffic, which might correspond directly to pageviews count, or it could mean an underlying problem in the application server.
Download Time
Download Time = responseEnd - responseStart
Download time measures the amount of time to download the requested content. Reducing the overall bytes transferred would immediately reflect upon Download time.
Employing pre-processing optimizations such as CSS/JS minification and a better compression ratio for the transferred resources would result in faster page loads and lesser bandwidth consumption as well.
A well-designed caching mechanism will also yield significant improvements in download time.
The end users' ISPs, and thus their network capabilities, should also be considered as another factor contributing to download time.
FirstByte Time
First Byte Time = responseStart - redirectStart
Time To First Byte measures the amount of time taken by the browser to receive the first piece of information for a request.
Time to first byte is a measure of the combination of the following stages of navigation ,
- The time taken to initiate a request.
- The time taken by the backend to process the request.
- The time taken by the client to receive the first byte of the processed request.
Document Rendering Time
Document Rendering Time = domComplete - domLoading
Document rendering time measures the amount of time taken by the browser to parse the HTML and render the DOM Tree.
This is essentially the time taken for parsing the parent document and its sub resources such as images, icons, etc. However, it does not include the execution time for referenced stylesheets or inline javascript. domComplete marks the beginning of the JS framework execution.
Page Rendering Time
Page Rendering Time = loadEventEnd - loadEventStart
Page rendering time measures the time taken for any additional logic following the page load. Page rendering time measure how long it takes to build the render tree. This involves querying both the CSS Object Model and the Document Object Model in addition to any Javascript logic to build the final render tree and its layout.
Optimizing the Critical Render Path by carefully choosing the order in which the resources are loaded and opting to load resources asynchronously will contribute to better front-end performance.
For cross-origin resources without the Timing-Allow-Origin header, most performance timing timestamps are not exposed. Their values will be recorded as 0.
