Node VM (NVM)
The APM Insight Node.js agent collects key metrics data from the Node.js Chrome V8. These metrics give you insight into Node.js VM behavior and help you improve the performance of your application. The agent also collects CPU metrics, which are usually analyzed with garbage collection (GC) metrics.
Native module and prerequisites
Node.js requires an additional native module to collect Node.js VM metric timeslice data related to garbage collection and event loop data. However, memory and CPU utilization are collected with or without the additional native module.
- The native module is automatically installed while installing the Node.js agent (v3.0.0 or higher).
- During installation, the native module first attempts to build from the source on the target machine. If the build fails, Node.js prints a stack trace to the console, which you can ignore.
- If the native module build is successful, you can see all the metrics, including garbage collection, memory usage, event loop data, and CPU utilization. If the build fails, you can only see memory and CPU related metrics.
Prerequisites to install Node.js native modules include:
Follow the node-gyp package instructions to compile the native module on your deployment platform.
| Platform | Python version recommended | Environment |
| Unix/Linux | v3.7, v3.8, v3.9, or v3.10 | Make, C/C++ compiler (such as GCC) |
| macOS | v3.7, v3.8, v3.9, or v3.10 | Xcode Command Line tools |
| Windows | v3.7, v3.8, v3.9, or v3.10 | Visual C++ Build Environment |
Please remember that there are three basic requirements (listed below) without which your build generation will fail. As a result, you will not get GC and event loop metrics in the client.
- Python
- Compiler
- NPX - From NPM 5.2.0, NPX is pre-bundled. So for the versions below that, you must install NPX separately.
View NVM metrics
Gain insight into useful runtime data for troubleshooting performance issues and monitoring your application's health with NVM metrics.
To view the NVM metrics in the client:
- Log in to your Site24x7 web client
- Navigate to APM > your Node.js application > click the Node VM tab.
- Select the time frame for which you need the metrics.

You will get the graphs and metrics using which you can troubleshoot performance issues.
For example:
- Memory usage increases when the application starts using more objects and garbage collection (GC) runs more frequently. CPU utilization will also increase due to the time spent in GC.
- Excessive synchronous code execution can increase CPU utilization. This will show spikes in the Max CPU time per tick chart.
Performance inference using graphs
On the right corner you can also decide on the time frame for which you need the metrics.

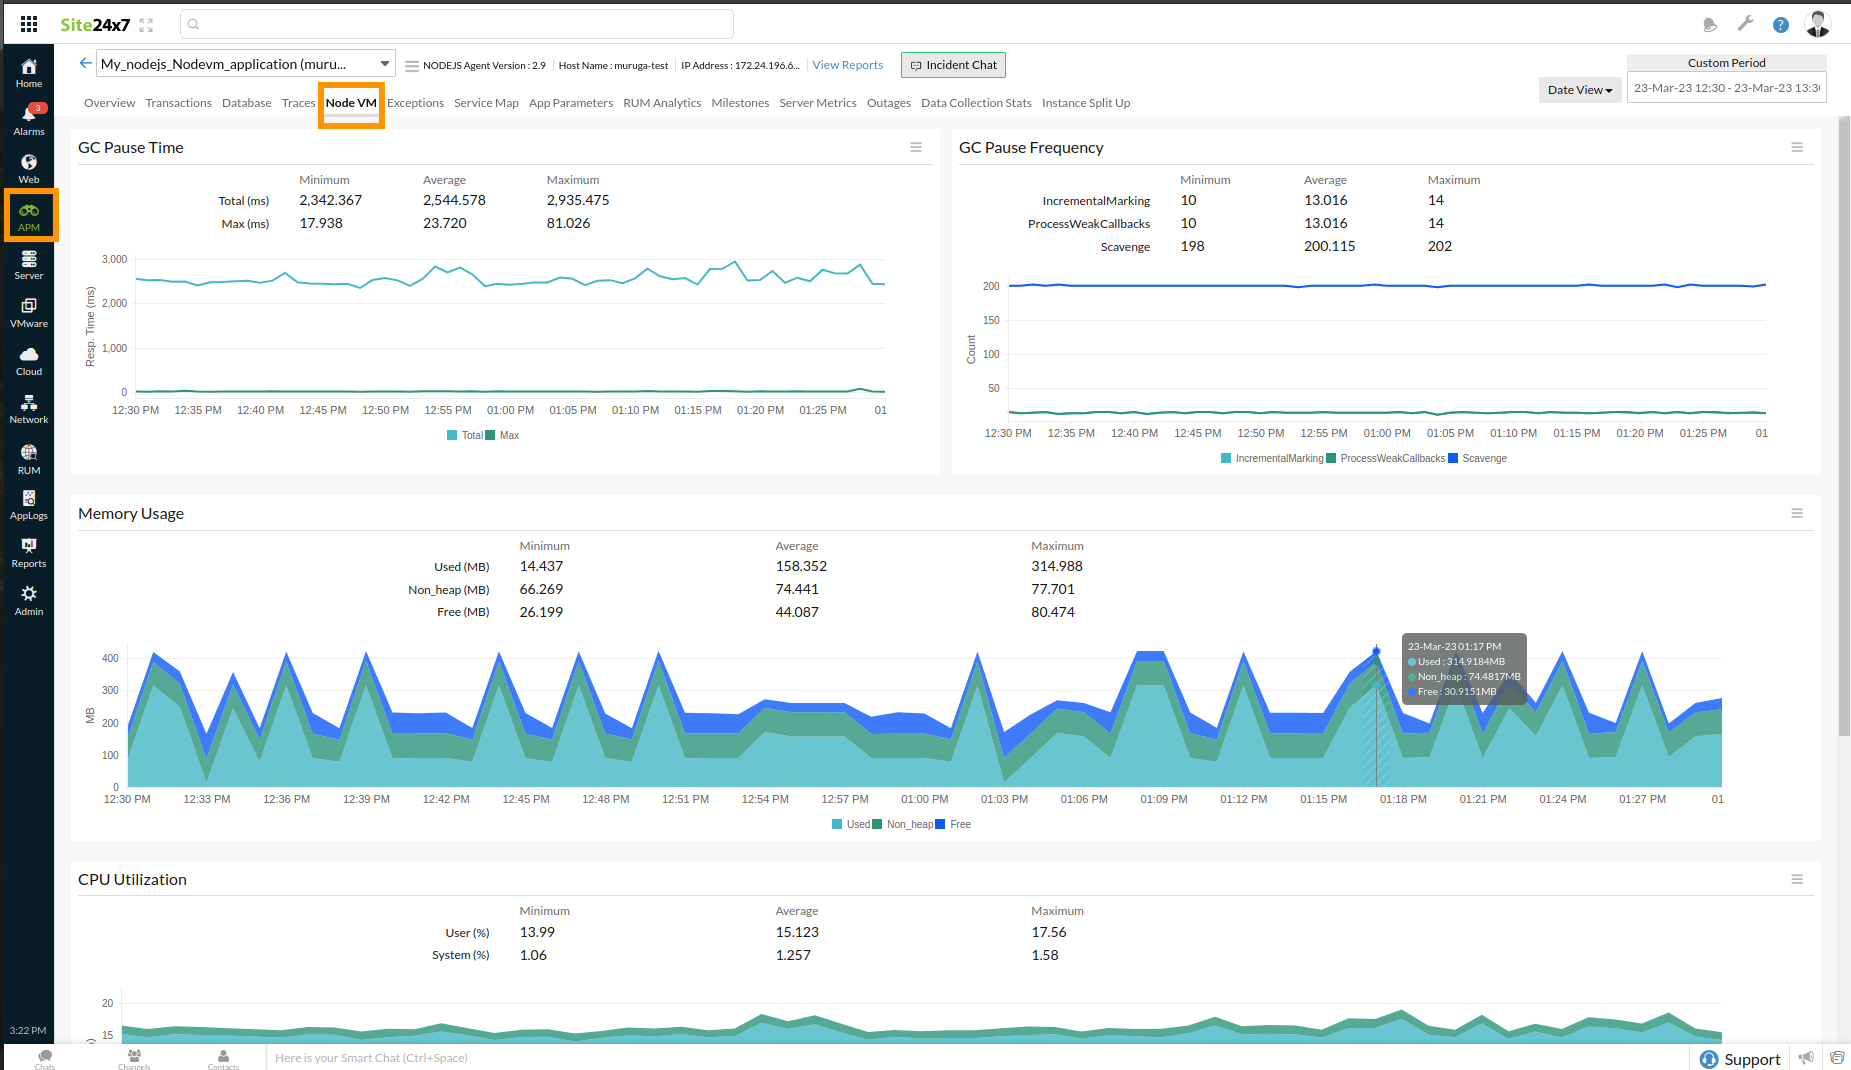
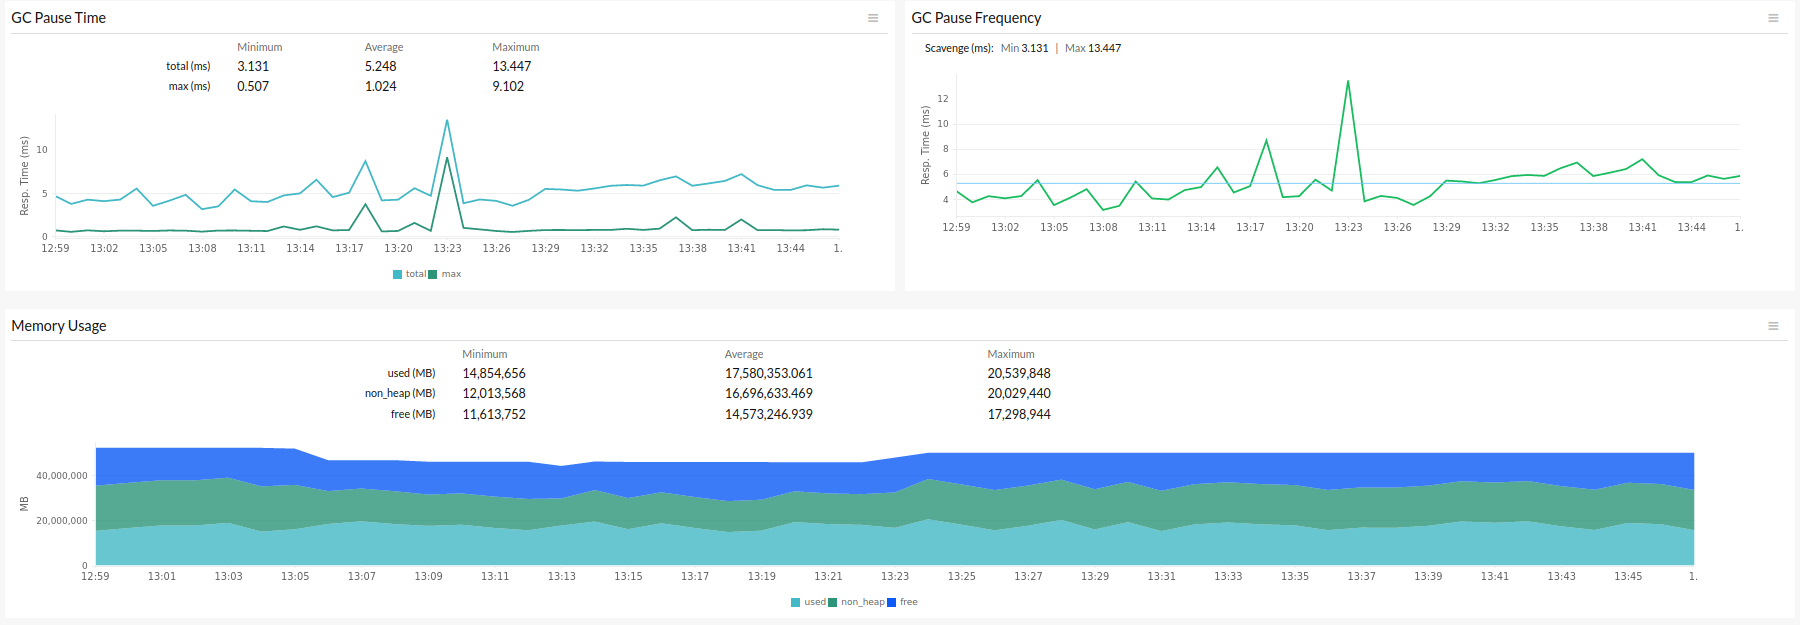
GC Pause Time
This graph depicts the amount of time spent on garbage collection. Spikes in GC time usually indicate a problem.
GC Pause Frequency
The graph shows the number of GC runs performed per minute.
Memory Usage
This graph shows the amount of memory consumed by the Node.js process.
| Parameter | Description |
| non_heap (MB) | The memory reserved for data outside V8's heap (for example, buffers or sockets). |
| free (MB) | The amount of memory set aside by V8 for memory pooling. This memory is not actively used, but is reserved for V8 to freely allocate more as needed. |
| used (MB) | The amount of memory that V8 uses (for example, JavaScript objects). |

CPU Utilization
This graph shows the CPU utilization of the Node.js process.
| Parameter | Description |
| user (%) | The amount of time used to execute the user code divided by wall-clock time. |
| system (%) | The amount of time used in the system kernel on behalf of the Node.js process divided by wall-clock time. |
Event Loop Ticks Per Minute
The number of event loop ticks per minute is shown in this graph. A tick is a single event loop turn in which functions that are ready to be executed are executed.
Node.js waits for pending I/O to complete during each event loop turn. When an I/O event is received, the event loop executes any associated callbacks. As a result, the number of ticks per minute corresponds to the frequency with which I/O events occur.
Max CPU time per tick
This graph shows the maximum amount of time spent in a single tick per minute. This is helpful for identifying an abnormally long event loop tick, which denotes extended synchronous code execution.
