Threshold and Availability Profiles for an ISP Latency Monitor
Once an ISP Latency monitor is successfully added to your Site24x7 account, you can create a threshold and availability profile, and configure limits for different ISP performance metrics at the parent and child level. If the configured limits are breached, you'll receive alerts based on the conditions set.
Add a Threshold and Availability Profile
- Log in to your Site24x7 account.
- Click Admin > Configuration Profiles > Threshold and Availability.
- Click Add Threshold and Availability on the Add Threshold Profile screen.
- Specify the following details:
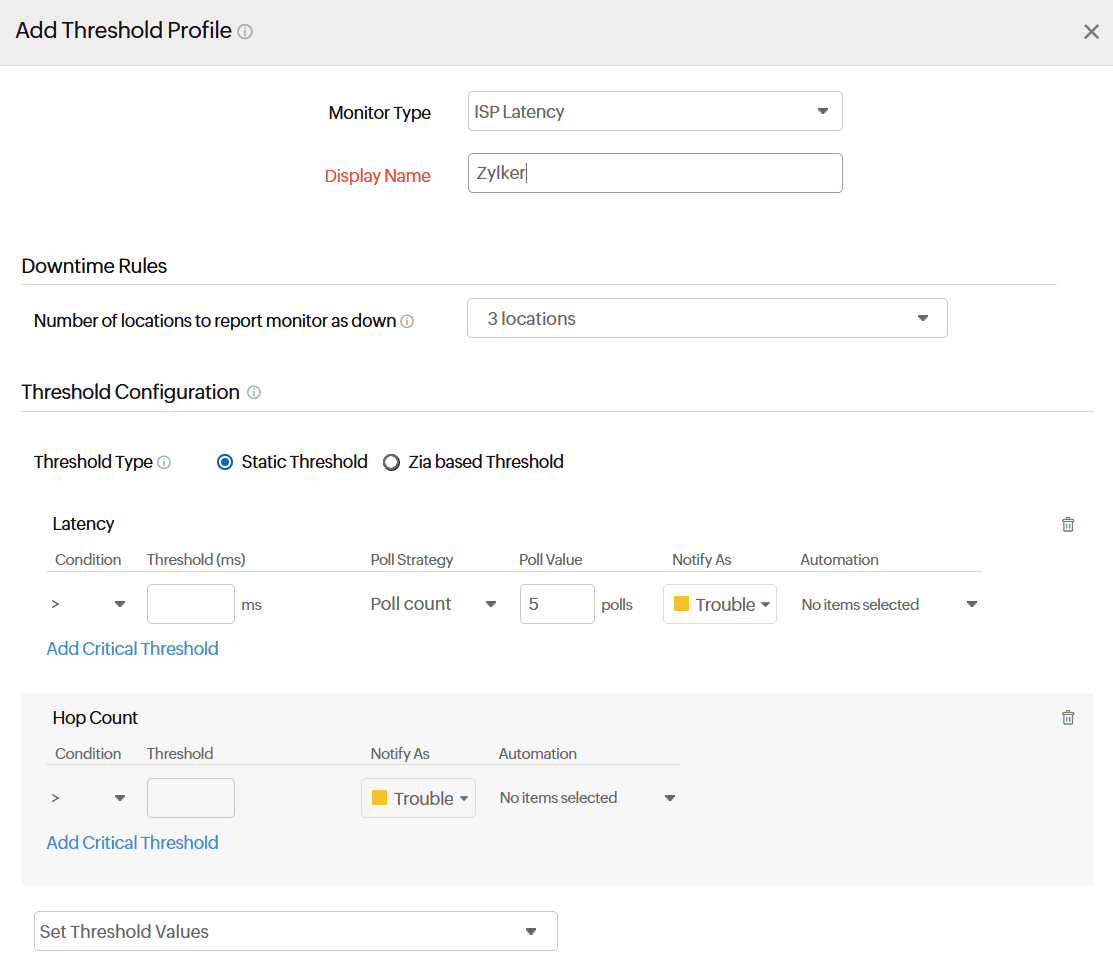
- Monitor Type: Select ISP Latency from the drop-down list.
- Display Name: Provide a label for identification purposes.
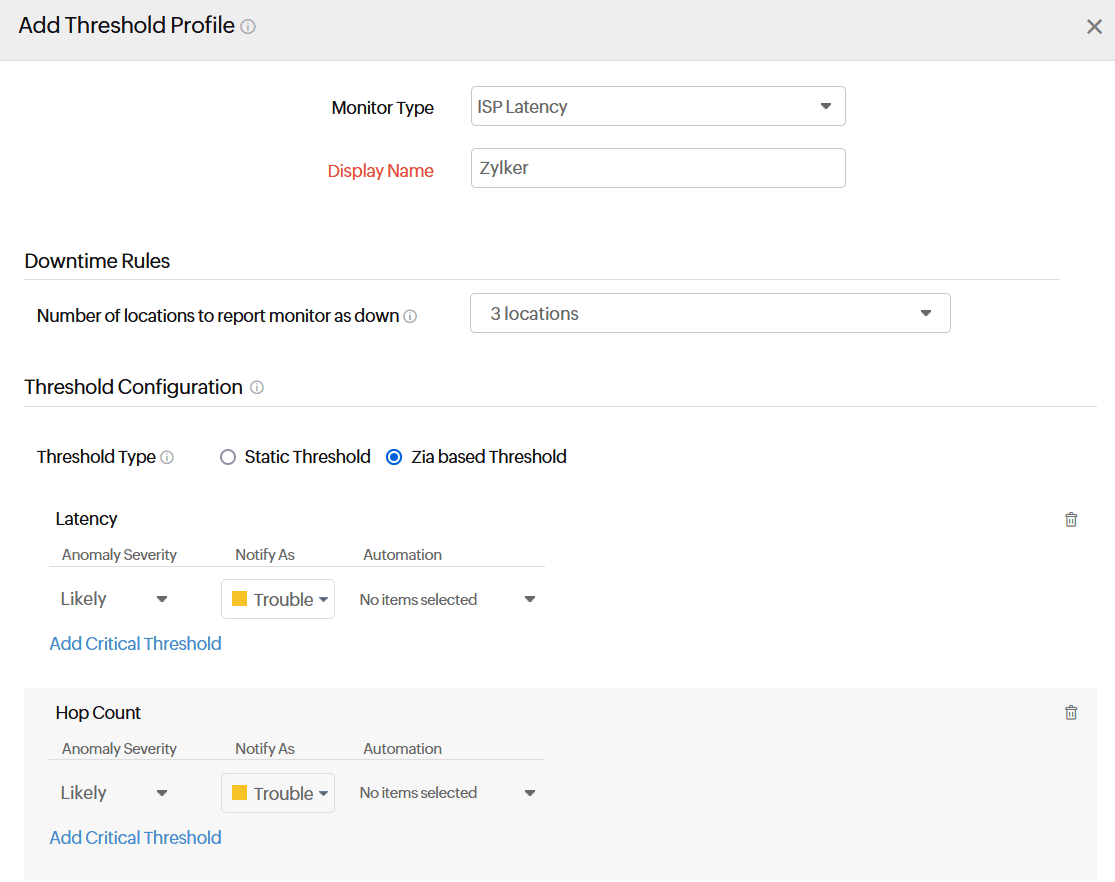
- Threshold Type: Choose the threshold type of your preference.
- 5.1 Static Threshold: Choose the static threshold and from the Set Threshold Value drop-down menu, choose the desired metrics for which thresholds need to be configured. Enter a value specific to the unit, and set the threshold conditions (<, <=, =, >, or >=) and the monitor state (Trouble or Critical) for each metric. You'll receive alerts when these threshold conditions are violated. Configure thresholds for the following metrics:
- Notify when the Hop Count exceeds the threshold: When the hop count exceeds the threshold, the monitor's status changes to Trouble or Critical. Hop count refers to the number of routers that a data packet crosses while traveling between the source and the destination.
- Notify when the Latency exceeds the threshold: The monitor's status changes to Trouble or Critical when the latency exceeds the threshold based on the poll strategy. Latency is the round trip time taken by a data packet to travel from the source to the destination and back again. The lower the latency, the higher the responsive rate.
- Notify when the Distinct AS Number Count exceeds the threshold: When the number of Autonomous System (AS) numbers in a routing path exceeds the threshold count, the monitor's status changes to Trouble or Critical.
- Notify when the AS Number on the Traceroute matches the threshold condition: The monitor status changes to Trouble or Critical when the AS number matches the threshold condition. The condition may be equals, not equals, contains, doesn't contain, on change, matches, starts with, and ends with.
- AS number of the Last Hop matches the threshold value: The monitor status changes to Trouble or Critical when the AS number of the last hop matches the threshold condition. The last hop is the final stage of the data packet from the source to the destination. The condition can be equals, not equals, contains, doesn't contain, on change, matches, starts with, and ends with.
- Notify when the Hostname on the Traceroute matches the threshold value: Monitoring will alert when the traceroute's hostname matches the specified threshold value. The monitor status will change to Trouble or Critical when the hostname on the traceroute aligns with the threshold condition.
A traceroute represents the path between the source and the destination on a network. The hostname is the name of an IP along the path to the destination. Users can set threshold conditions to avoid passing through specific hosts. Conditions may include equals, not equals, contains, doesn't contain, on change, matches, starts with, and ends with. - Notify when the Jitter exceeds the threshold: Jitter is the time delay of the packets received on a network. If the jitter exceeds the threshold limit, the user will be alerted and the monitor status will change to Trouble or Critical.

- 5.2. Zia-based Threshold:
The Zia-based threshold tracks abnormal spikes using anomaly detection and offers a dynamic threshold updated accordingly. If you choose a AI-based threshold, select the associated anomaly severity and status accordingly.
The static set threshold values apply to the Zia-based threshold.
- 5.1 Static Threshold: Choose the static threshold and from the Set Threshold Value drop-down menu, choose the desired metrics for which thresholds need to be configured. Enter a value specific to the unit, and set the threshold conditions (<, <=, =, >, or >=) and the monitor state (Trouble or Critical) for each metric. You'll receive alerts when these threshold conditions are violated. Configure thresholds for the following metrics:
- Click Save. The threshold and availability profile created for the ISP latency monitor will be automatically listed on the Threshold and Availability screen along with any profiles you've already created.
Edit a Threshold and Availability Profile
- Go to Admin > Configuration Profiles > Threshold and Availability.
- Click the profile that you'd like to edit.
- Edit the necessary parameters in the Edit Threshold Profile window.
- Click Save.
Delete a Threshold and Availability Profile
- Go to Admin > Configuration Profiles > Threshold and Availability.
- Click the profile that you'd like to delete in the Threshold and Availability screen.
- This will redirect you to the Edit Threshold Profile window.
- Click Delete.
Associate a threshold profile
- Go to Web > ISP Latency.
- Click the hamburger icon next to the desired ISP Latency Monitor, and click Edit.
- In the Edit ISP Latency Monitor window that opens, under Configuration Profiles - Threshold and Availability, choose a threshold profile from the drop-down menu. You can also add a new profile, and click Save.
Configure thresholds for metrics at the child level
To do this, navigate to Web > ISP Latency, and scroll down to view the Latencies of all Paths. Under Actions, click the Edit icon to configure limits for the metrics in each path.
Bulk update thresholds for locations
You can also update thresholds for all metrics in each location at once. To do this:
- Navigate to Web > ISP Latency > monitor name > Summary. Under the Latencies of all Paths section, click Threshold Configuration.
- Child Monitors: Choose the locations from the drop-down and click Done.
- Skip Alert: Toggle to Yes if you don't want to receive an alert when individual thresholds are breached. If you want to receive alerts, leave it on No.
- Enter a value specific to the unit, and set the threshold conditions (<, <=, =, >, or >=) next to Latency, Jitter, Hop Count, and Distinct AS Number.
- Click Save.
