File Upload
File Upload monitor regularly checks the availability and response of your API endpoints over IPv4 or IPv6 enabled locations. This monitor type will include multipart data (text and files) in the request body. You will be alerted if the API response values does not validate against the specified RegEx/XPath/JSONPath assertions.
Use cases
What is File Upload monitoring?
Say for instance that you've a support portal where customers can raise their concerns, upload load files, or images. With File Upload monitoring, you can ensure whether the files are getting uploaded without errors, by checking the availability of your API endpoints.
Will you be able to receive alerts when your service goes down?
Yes, you can configure the alert settings in such a way to receive notifications in your preferred mode, when the status of your monitor is Down.
How can you validate the response when the file gets uploaded successfully?
You can validate the response by configuring the response format and assertions of your preference. You can configure the settings in such a way to receive alerts when the assertions fail.
Will I be getting alerted when the response time exceeds?
You can, by creating a configuration to get notified when the response time breaches the set threshold.
Can you use your own files or the Site24x7 file?
You can use only Site24x7 file.
Can I use my own custom user agent?
Yes, you can use your own custom user agent. In case of not configuring any, Site24x7 agent will be added by default.
Add a File Upload monitor
General Settings
- Login to Site24x7.
- Click Admin > Inventory > Monitors > Add Monitor.
- Select File Upload from the list of monitors on the Add Monitor page.
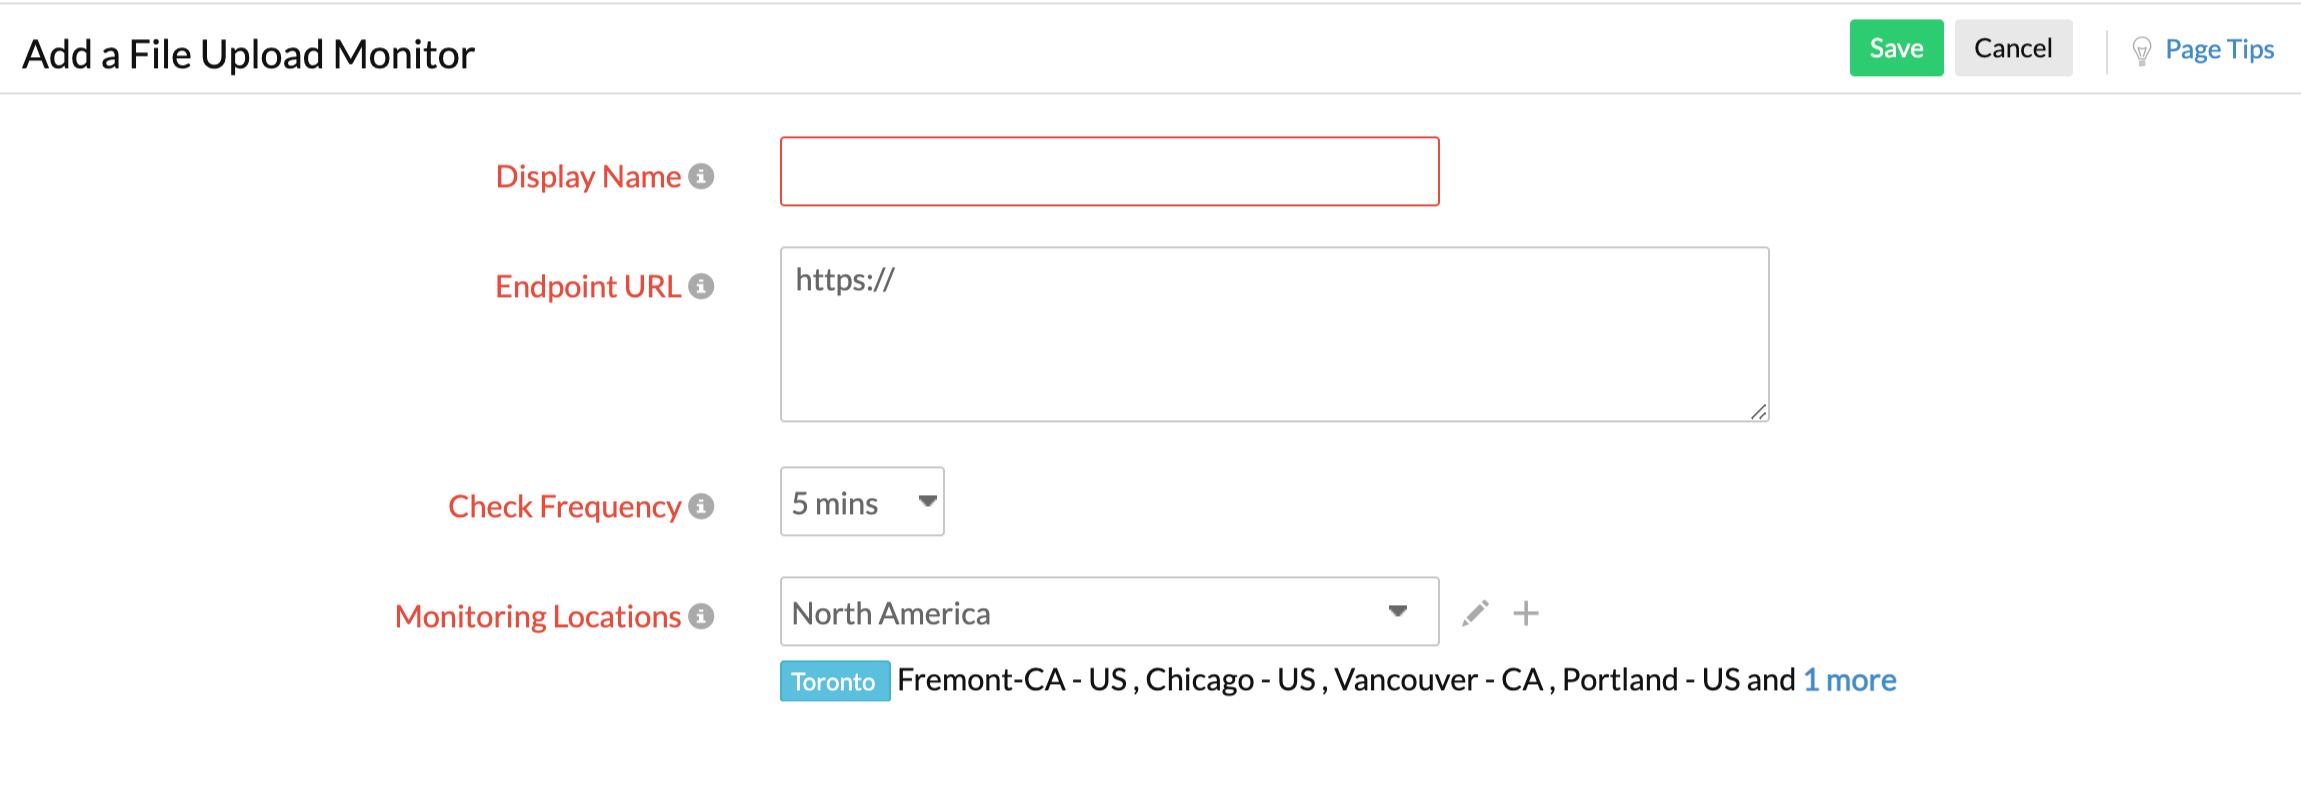
- Specify the following details to add the monitor:
- Display Name: Provide an appropriate name for the URL you want to monitor.
- Endpoint URL: Provide the URL which should to be monitored.
- Check Frequency: Choose the required polling frequency. The frequency can be set from five minutes to one day.
- Monitoring Locations: Select a location profile from where you want the URL to be monitored from the drop-down list. To know more, refer to Location Profile.

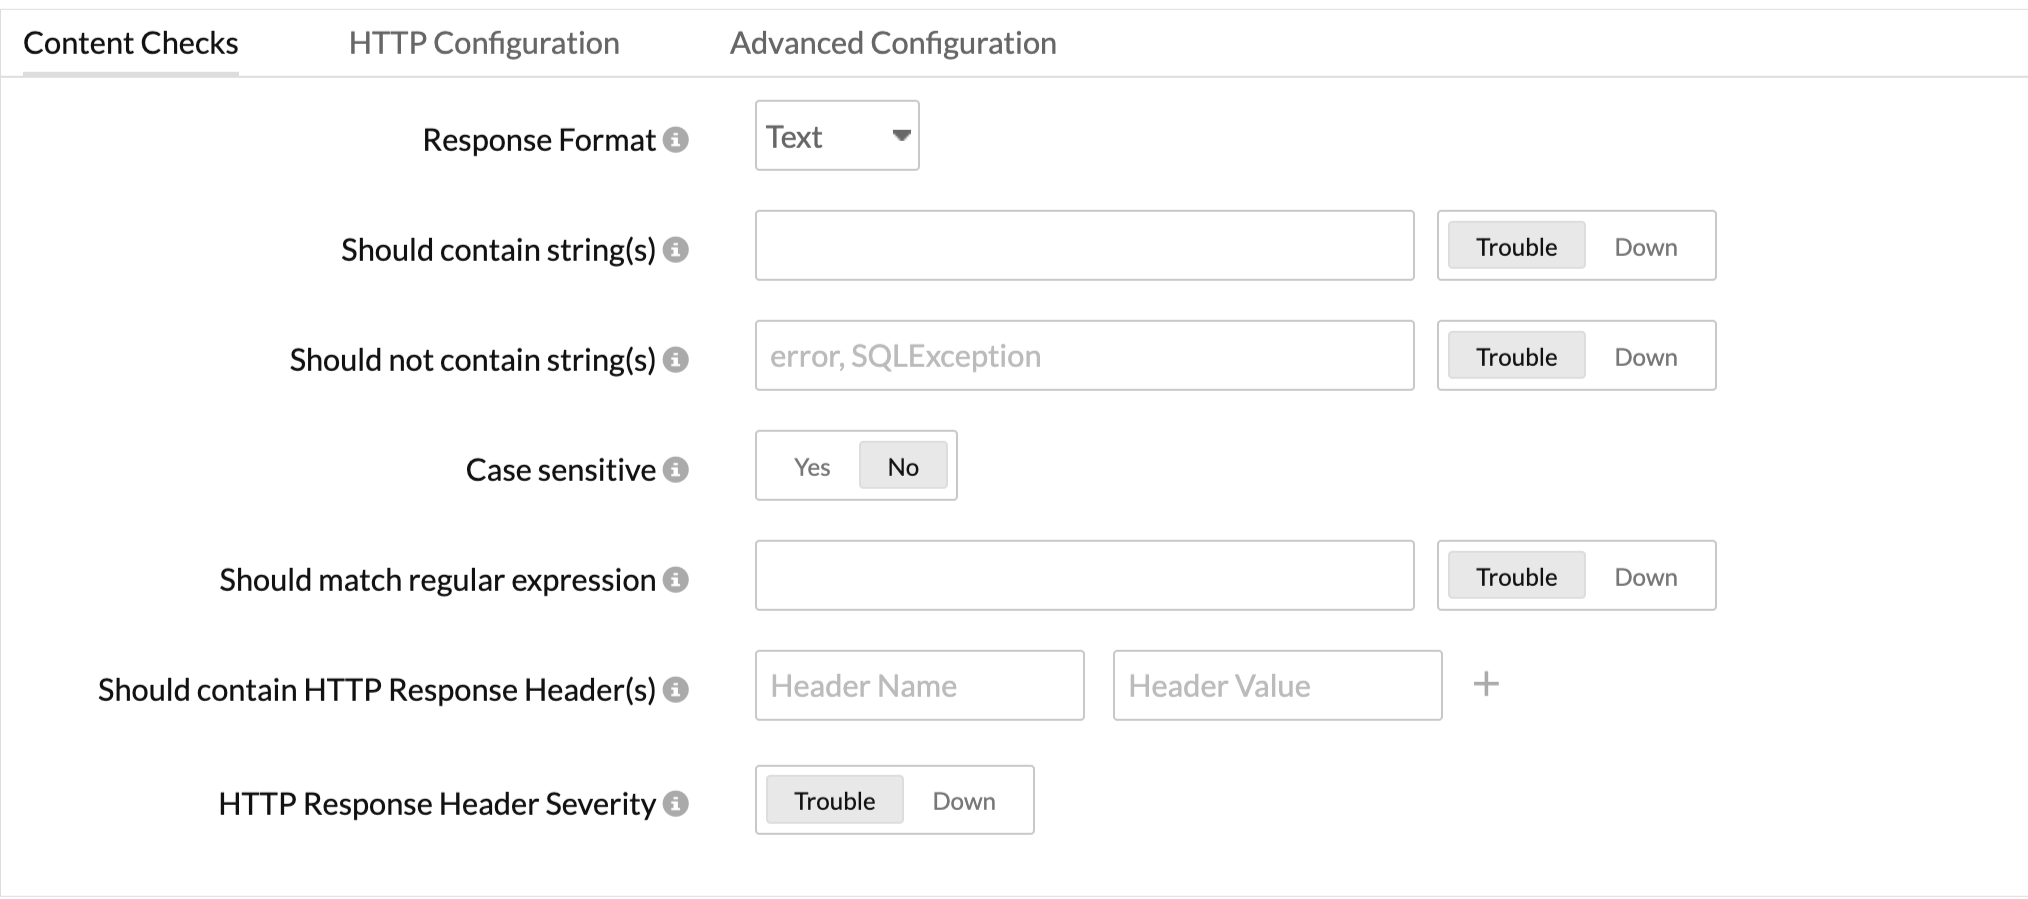
- Specify the following details for Content Checks: Choose the response format of your preference.
If the selected Response format is Text- Should contain string(s): Get alerted when the specified keywords are not present in the website. Mention the keywords in the check box and use the slider button to trigger the required alert.
- Should not contain string(s): Get alerted when the specified keywords are present in the website content. Mention the keywords in the check box and use the slider button to trigger the required alert.
You must adhere to the following conditions while adding keywords in the given field: A single string or keyword can be configured with or without any double quotes (ex: HTML). If there are two strings, which comprise a single keyword, add a space in between the two strings and enclose it with double quotes. (ex: "HTML response"). In case you have more than two of the individual keywords configured, you will have to separate them with a space and also use double quotes for each of them. ("monitor" "HTML" "data"). - Case Sensitive: Enable the toggle button for this option.
- Should match regular expression: Configure your alerts based on whether a particular pattern matches with the website content or not. For example, when you consider the expression ^[a-z0-9_-]{3,15}$, your website content should contain alphabets from a to z, numbers from 0 to 9, underscore, and a hyphen. Also, there should be a minimum length of three characters and a maximum length of 15 characters. When it is not matched, an error will be reported for your website as the reason, for example "Regular expression"^[a-z0-9_-]{3,15}$" does not match". Learn more about Content Checks.
If the selected Response format is XML - XPath or XML Path Language is a query language for selecting nodes from an XML document. Use the Site24x7 XPath Evaluator for more help.
- XPath Expression: Provide an XPath expression to enable the evaluation of the XPath expression assertion. The assertion must successfully parse the XPath in the XML to display a success. You can add multiple XML expression assertions by clicking the + key.
- XPath Severity: Specify the alert severity as Down or Trouble to display the status when the specified XPath expression assertion fails due to a mismatch.
If the selected Response format is JSON - JSONPath Expression: You can specify a JSONPath assertion and test an expected data in the JSON response. For a successful test, the assertion must successfully parse the JSONPath in the JSON. If you need help to build a JSONPath assertion to test against your JSON response, you can use Site24x7 JSONpath expression for help. You can always add multiple such JSONPath assertions to test individual use cases. Use the + button to add more expression assertions.
Note
- Actual value is empty
- Actual value is not empty
- Actual value equals the target value
- Validates that the actual value is greater than or equal to the target value
- Validates that the actual value is less than or equal to the target value
- Actual value contains target value as substring
- Target value is not contained in the actual value
Whenever an assertion is processed, the target value in your JSON assertion compares the actual value in the JSON Response to check multiple test scenarios.
Common test scenarios that can be checked include:
- JSONPath Severity: You can specify the alert severity as Down or Trouble. When the JSONPath assertion fails during a test, an alert will automatically be triggered.
- JSON Schema Check: JSON Schema is a vocabulary that enables you to annotate and validate all JSON endpoints for your web service. To test the HTTP response data against the schema, enable the rocker button to Yes and post the JSON schema validation assertion in the text field. In case you've kept the text field empty after selecting the rocker button to Yes, the data collection will still occur as usual without any impact on the overall monitor status.
- JSON Schema Severity: You can specify the Alert Severity as Down or Trouble.
Note
When the JSON Schema validation fails during a content check, an alert will be automatically triggered based on your setting.
Below are the common use cases tested when the API responses are validated against the defined JSON schema:
Verifying whether values are of a certain type (e.g. integer, string, etc.)
Ensuring the API JSON responses are structured properly
Checking for the existence of the required keys in the JSON response
Testing whether an incorrect HTTP response (like an HTML or XML) validates against your given JSON schema. - Should contain HTTP Response Headers: Enter the desired response header and values for your HTTP request and verify whether the HTTP headers are present, or the values match with the desired response. Trigger a Trouble or Down alert during a check failure. While configuring the response header check, you must add values based on the following conditions: You can add multiple headers and each header can accept multiple values. A single value can be configured with or without any double quotes (e.g.: keep-alive or "keep-alive"). In case you have multiple header values configured, you will have to separate them with a space and also use double quotes for each of them. (e.g., "gzip" "br"). Header value can also support regex validation. The regex pattern should be "${}". For example, ${\d{4}} can be used to search for four continuous digit numerical value in the value of the header configured in the header name.
- HTTP Response Header Severity: Use the toggle button to specify the alert severity as Down or Trouble. When the test fails, an alert will be automatically triggered.

- Specify the following details for HTTP Configuration:
- HTTP Method: Specify the method to be used for connecting with the site--POST or PUT. Select the appropriate radio button to configure your form submission method. Also, select the appropriate body type for POST and PUT.
Note
Both POST and PUT methods support Binary and Multipart types.
- Request Body: Choose the type of request body and the content to be included. File Upload monitor supports two request body types: Binary and Mulitpart.
- Binary: Binary type request will carry a single file in the request body.
- Multipart: In Multipart type requests, you can add the content as multiple files or as text in the request body. HTTP Request Headers: Customize header information by providing additional header name and header value here.
- User Agent: Configure customized user agents (web browser) for sending your requests and HTTP headers. You can choose from the available list of user agents.
- Authentication Method: Choose the authentication method of your preference from the options provided.
- Basic/NTLM: Configure your Basic/NTLM based authorization. This authentication protocol is used for systems running on Windows OS.
- Web Credentials: Specify your User Name and Password for URLs requiring Basic/NTLM based authentication.
- Kerberos/Negotiation: If you are monitoring a resource secured by Kerberos authentication, select the Kerberos/Negotiation radio button.
- Kerberos Authentication: Select the Kerberos credential profile from your preconfigured list or create a new Kerberos authentication profile by clicking the (+) button.
Note- Kerberos authentication is supported only for On-Premise Poller locations.
- Learn how to configure a Kerberos credential profile.
- Kerberos Authentication: Select the Kerberos credential profile from your preconfigured list or create a new Kerberos authentication profile by clicking the (+) button.
- OAuth: Enable radio button next to OAuth, if you're monitoring a resource that is secured by the OAuth framework.
- OAuth Provider Name: Select the OAuth Provider Name from your preconfigured list, or create a new OAuth profile by clicking the + button. Learn how to configure an OAuth Provider.
- Web Token: Register Site24x7 with your authentication server to monitor resources protected using web tokens.
- Web Token Name: Select the Web Token Name from your preconfigured list, or create a new Web Token profile by clicking the + button. Learn how to add a Web Token.
- Basic/NTLM: Configure your Basic/NTLM based authorization. This authentication protocol is used for systems running on Windows OS.
- Query Authoritative Name Server: Use the toggle button to mark your preference for resolving the domain name.
- Accepted HTTP status codes: Provide a comma-separated list of HTTP status codes that indicate a successful response. You can specify individual status codes as well as ranges separated with a colon. Learn more about Accepted HTTP Status codes.
- Client Certificate: Upload the client certificate for enabling client certificate authentication.
- SSL Protocol: Specify the version number of the TLS/SSL protocol (TLSv1.3, TLSv1.2, TLSv1.1, TLSv1, and SSLv3 are supported) to validate the SSL handshake. Use Auto mode to enable automatic detection and negotiation.
NoteSSL Protocol validation works only for HTTPS domains. If you've specified a different SSL protocol version than the actual one, the monitor status fails during the poll. SSL Protocol validation works only for HTTPS domains. If you've specified a different SSL protocol version than the actual one, the monitor status fails during the poll.
- HTTP Protocol: Choose the preferred version of the application-layer protocol (HTTP/1.1 or HTTP/2) to be used for negotiation.
- Enable ALPN: Enable ALPN to ensure that only supported application protocols are sent as part of the TLS handshake and ensure reduced round trip time. By default, it'll be set to Yes. Enable ALPN option isn't supported by On-Premise Poller. We'll be extending the support in the next update.

- HTTP Method: Specify the method to be used for connecting with the site--POST or PUT. Select the appropriate radio button to configure your form submission method. Also, select the appropriate body type for POST and PUT.
- Specify the following details for Advanced Configuration:
- Connection Timeout: Specify the time in seconds within which the connection should be established with the target server.
- Prefer IPv6: To monitor your endpoint URL over IPv6 enabled locations, toggle to Yes. Site24x7 lets you monitor your dual-stacked IPv4/IPv6 based infrastructure as per your preference. IPv4 will be enabled as the default protocol. You'll be able to monitor your IPv6 infrastructure only after you set the option to Yes. If the connectivity for IPv6 fails, it will not fall back to IPv4 automatically. Read more.
If you enable IPv6, that means it won't monitor IPv4 as well. You will need to configure two separate monitor checks to be able to monitor both IPv4 and IPv6. - Monitor Groups: You can organize your monitors into different monitor groups for ease of administration. You can also associate your monitor with multiple monitor groups by selecting the relevant monitor groups from the drop-down list. This enables you to logically group your monitors.
Note
Multiple monitor group support for monitors allow a monitor to be associated with multiple dependent resources in different monitor groups. During a normal monitor status check, if the status of any one of these dependent resources is identified as Down, the alert for the monitor will be suppressed automatically. However, the dependency configuration at the monitor level is always given the higher priority over any other monitor group level dependency configuration for suppressing alerts.
- Dependent on monitor: Select a monitor from the drop-down list to choose it as your dependent resource. You can add up to five monitors as dependent resources. Alerts to your monitor will be suppressed based on the Down status of your dependent resource.
Note
Configuring a dependent resource and suppressing alerts based on the dependent resource's status is part of providing you with better false alerts protection. Learn more about alert suppression at monitor level. If you select None in the dependent resource field, alerting will progress as per your normal configuration settings. No alerts will be suppressed in this case as the monitor doesn't have any dependent resource.

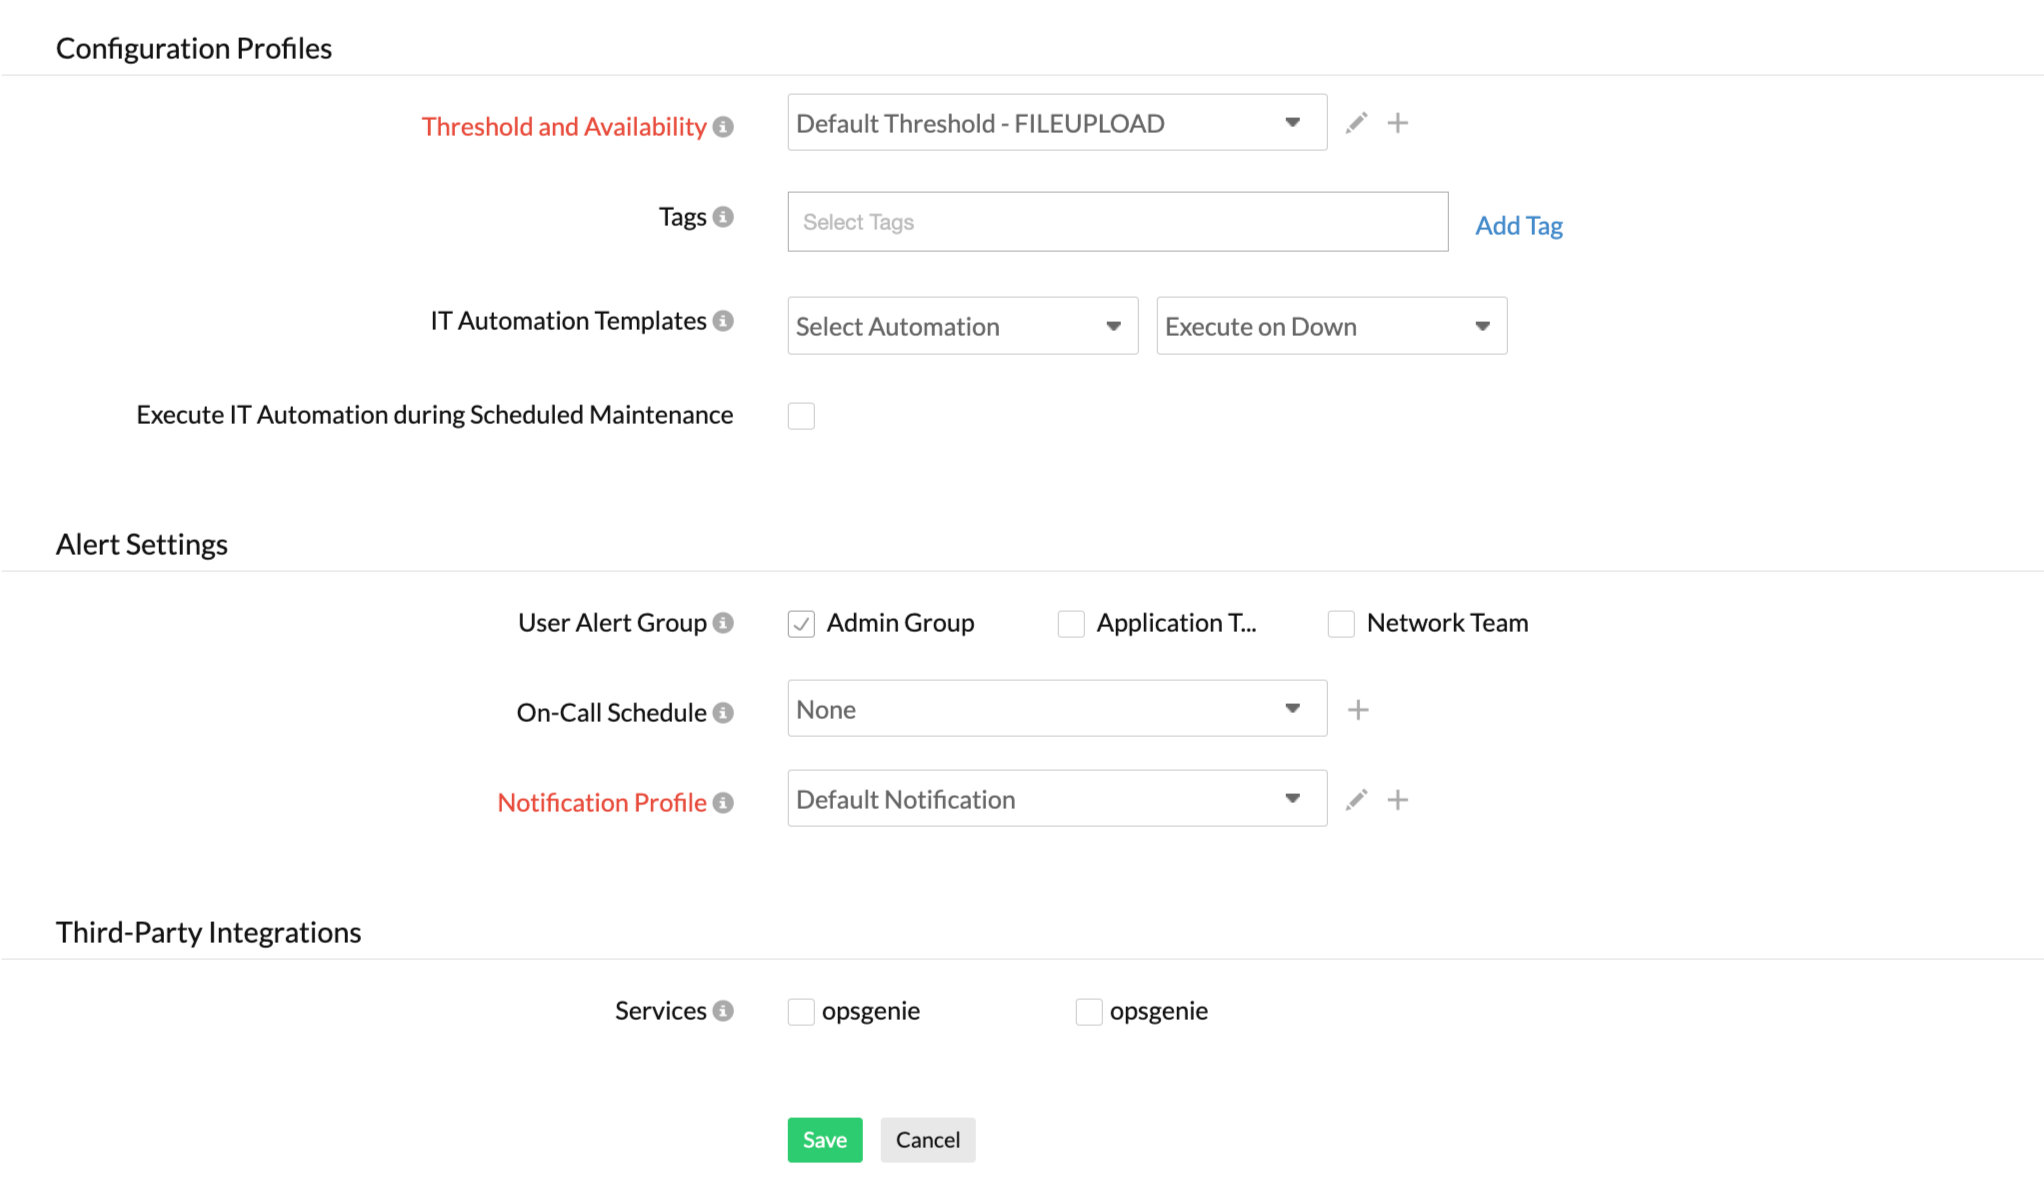
- Specify the following details for Configuration Profiles:
- Threshold and Availability: Select a threshold profile from the drop-down list, or choose the default threshold set available, and get notified when the resources cross the configured threshold and availability. To create a customized threshold and availability profile, refer to Threshold and Availability.
- Tags: Associate your monitor with predefined Tag(s) to help organize and manage your monitors creatively. Learn how to add Tags.
- IT Automation: Select an automation to be executed when the website is Down/Trouble/Up/any status change/any attribute change. The defined action gets executed when there is a state change and selected user groups are alerted. To automate corrective actions on failure, refer to IT Automation.
- Execute IT Automation during Scheduled Maintenance: Configuring a scheduled maintenance window allows you to suppress alerts for select IT resources during routine maintenance tasks. Select the check box to enable the option to execute IT automations—script executions, server commands, and more—during this period.

- Alert Settings:
- User Alert Group: Select the user group that needs to be alerted during a outage.To add multiple users in a group, see User Alert Group.
- On-Call Schedule: The On-Call Schedule option helps you ensure that the notifications are sent to assignees in specific shift hours to help them to respond to alerts or incidents quickly. Choose an On-Call of your preference from the drop-down.
- Notification Profile: Choose a notification profile from the drop down or select the default profile available. Notification profile helps to configure when and who needs to be notified in case of downtime. Refer to Notification Profile to create a customized notification profile. You can receive alerts if the monitors are associated with user groups irrespective of the On-Call shift you've configured.
- Third-Party Integrations: Associate your monitor with a preconfigured third-party service. This lets you push your monitor alarms to selected services and facilitate improved incident management. If you haven't setup any integrations yet, navigate across to Admin > Third-Party Integrations to create one. Learn more about third-party integrations.
- Click Save. Once the monitor setup is completed, the Site24x7 deep discovery wizard scans your domain and auto detects all related internet resources for your domain that can be added to your account to provide comprehensive internet services monitoring. Explore more about internet services deep discovery.
