End-to-end monitoring for your FortiGate VPN solutions
Monitor your VPN's availability, health, and performance using Site24x7's SaaS network monitoring solution. Simply add your whole VPN for monitoring, or specify certain devices using an IP range. Site24x7 will start collecting metrics by associating each device with a suitable default template. You can also add any device, and monitor any metric using its OID, with custom SNMP monitoring.
Using Site24x7’s ping and traceroute options, you can confirm whether a VPN connection over a LAN interface has been configured correctly.
Configure SNMP traps on the monitored devices to receive instant alerts. You can also create network topology maps, custom dashboards, and custom reports, and customize what data you want to view and how it should look.

Monitor VPN performance with a unified view of all metrics
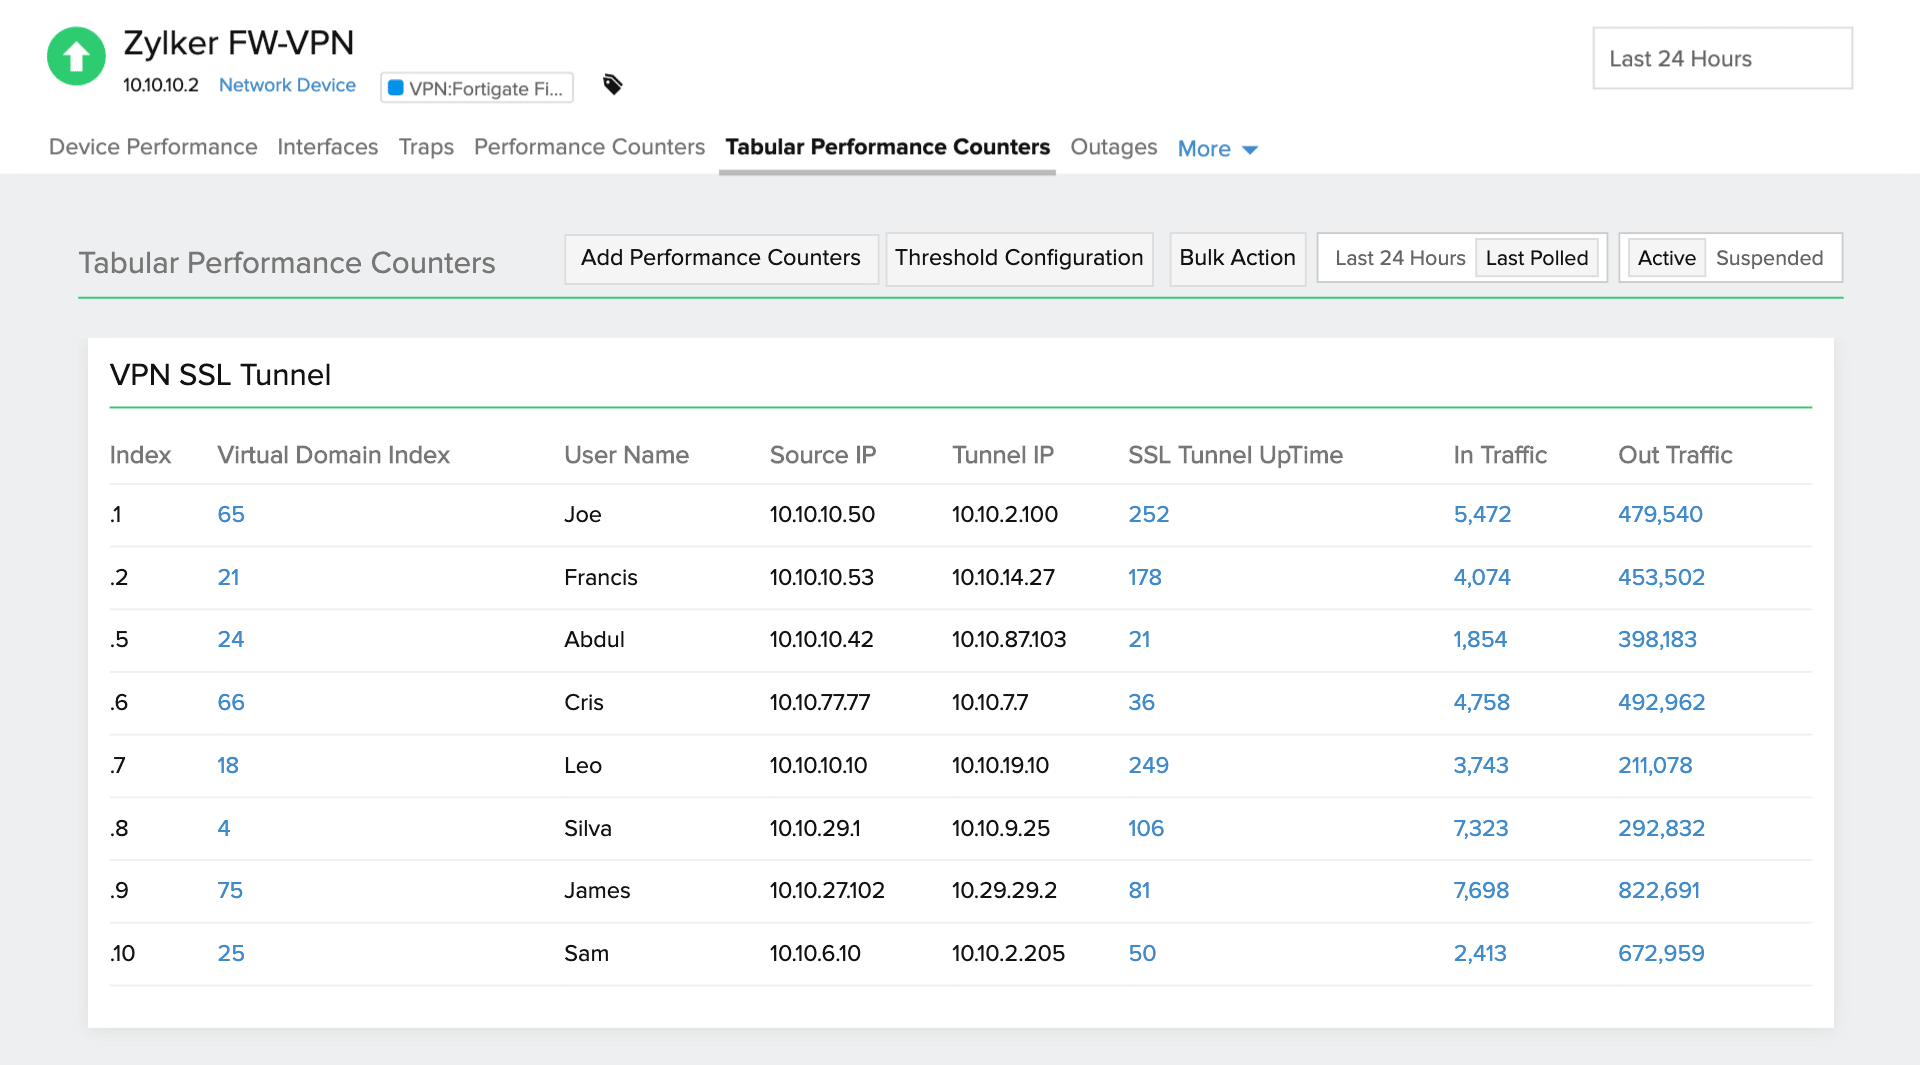
Monitor various performance metrics for FortiGate next-generation firewalls (NGFWs), FortiGate 1100E, FortiGate 2200E, and more devices. Failed VPN connection attempts and mismatched preshared keys are common. You may have a tunnel that goes down frequently, or a problem with your LAN interface connection. Issues could occur at either end of the tunnel. It’s crucial to thoroughly monitor your VPN from end to end to ensure it’s performing optimally. Here's a partial list of the metrics we provide by default:
| Metric | Description | OID |
|---|---|---|
| Active SSL VPN users | The current number of users logged in through SSL VPN tunnels in the virtual domain. | .1.3.6.1.4.1.12356.101.12.2.3.1.2.1 |
| VPN SSL tunnel uptime | The uptime of SSL VPN tunnels (in secs) from the time of VPN reboot. | .1.3.6.1.4.1.12356.101.12.2.4.1.6.1 |
| VPN bytes received | The number of bytes received on the tunnel since instantiation. | .1.3.6.1.4.1.12356.101.12.2.1.1.9 |
| VPN bytes sent | The number of bytes sent on the tunnel since instantiation. | .1.3.6.1.4.1.12356.101.12.2.1.1.10 |
| VPN tunnel traffic in | The number of incoming bytes of layer 2 traffic through this tunnel since it was established. | .1.3.6.1.4.1.12356.101.12.2.4.1.7 |
| VPN tunnel traffic out | The number of outgoing bytes of layer 2 traffic through this tunnel since it was established. | .1.3.6.1.4.1.12356.101.12.2.4.1.8 |
| Active VPN SSL tunnels | The current number of active SSL tunnels in the virtual domain. | .1.3.6.1.4.1.12356.101.12.2.3.1.6.1 |
Monitor more metrics and devices
Monitor any SNMP VPN device and any performance counter by simply specifying the OIDs. With Site24x7, you can import OIDs from the built-in MIBs in the Site24x7 web client. Here's a sample list of custom metrics and their OIDs from FORTINET-FORTIGATE-MIB:
| Metric | Description | OID |
|---|---|---|
| VPN tunnel up count | The number of IPsec VPN tunnels with at least one security association (SA). | .1.3.6.1.4.1.12356.101.12.1.1.0 |
| VPN SSL logged-in users | The current number of users logged in through SSL VPN tunnels in the virtual domain. | .1.3.6.1.4.1.12356.101.12.2.3.1.2 |
| Active SSL web sessions | The current number of active SSL web sessions in the virtual domain. | .1.3.6.1.4.1.12356.101.12.2.3.1.4 |
| VPN SSL state | Whether SSL VPN is enabled on this virtual domain. | .1.3.6.1.4.1.12356.101.12.2.3.1.1 |
| VPN SSL tunnel username | The username used to authenticate the tunnel. | .1.3.6.1.4.1.12356.101.12.2.4.1.3 |
| VPN tunnel bytes out | The number of bytes sent out on the tunnel. | .1.3.6.1.4.1.12356.101.12.2.2.1.19 |
| VPN tunnel bytes in | The number of bytes received on the tunnel. | .1.3.6.1.4.1.12356.101.12.2.2.1.18 |
Get more than just performance data
Scalability
Scales to monitor thousands of network devices
Network Discovery
Add multiple devices at once using an IP range
Alerts and Reports
Get timely downtime alerts, and view reports with graphs
High Availability
Ensure high network availability by optimizing bandwidth allocation