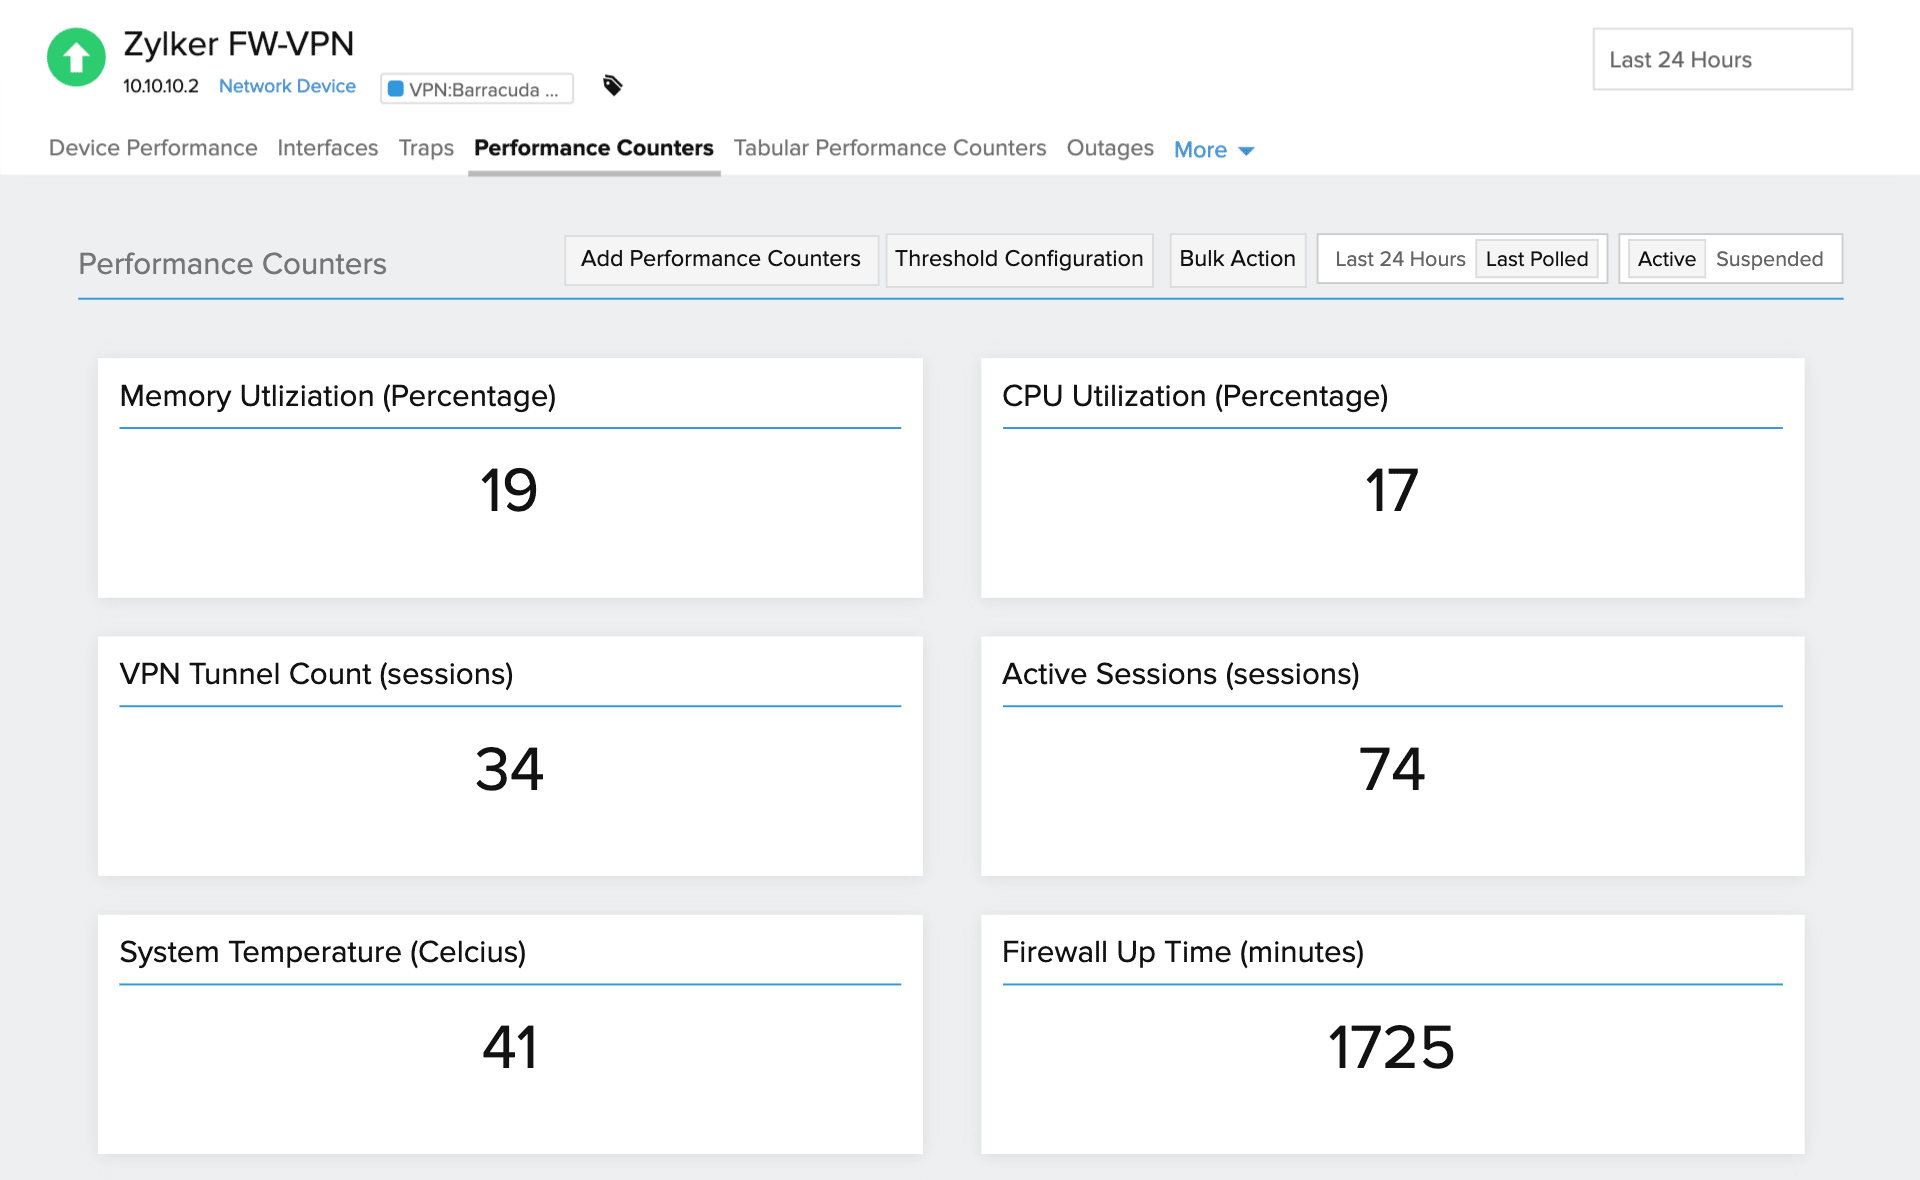
SNMP counters to keep tabs on your VPN
Discover your VPN and add devices for monitoring using an IP range. Monitor your Barracuda CloudGen firewalls and other devices using performance counters. Site24x7 also offers the flexibility to monitor even more devices, in addition to those supported by default, using custom SNMP monitoring.
Obtain a holistic view of your entire network with maps and dashboards. You can also create custom reports and analyze VPN usage trends. Furthermore, you can configure thresholds and alerts, and also receive instant device-level alerts using SNMP traps.

Monitor VPN performance with a unified view of all metrics
When using firewalls and VPN devices, you generally come across errors like a failed connection due to a handshake request time-out, a next-generation firewall (NGFW) pattern update, or a firewall status mismatch. A Windows update or firmware update can also break your client. If your firewalls are integrated with Active Directory (AD), it could be that your AD user credentials or just a local account credential have hindered your login. Sometimes errors can occur because you haven’t updated the Barracuda Network Access (NAC) or VPN client.
Most of the issues above can be averted if your Barracuda VPN devices are properly monitored.
Here's a partial list of the metrics we provide by default. You can also monitor any other metric by simply entering its OID, or importing the OID using Site24x7's built-in MIB browser.
| Metric | Description | OID |
|---|---|---|
| VPN tunnel status | The status of the VPN tunnel. | .1.3.6.1.4.1.10704.1.11 |
| VPN tunnel count | The number of live client-to-site VPN tunnels. | .1.3.6.1.4.1.10704.1.6.1.2 |
Get more than just performance data
Scalability
Scales to monitor thousands of network devices
Network Discovery
Add multiple devices at once using an IP range
Alerts and Reports
Get timely downtime alerts, and view reports with graphs
High Availability
Ensure high network availability by optimizing bandwidth allocation