Manage your complex networks with our Fortinet monitoring tool
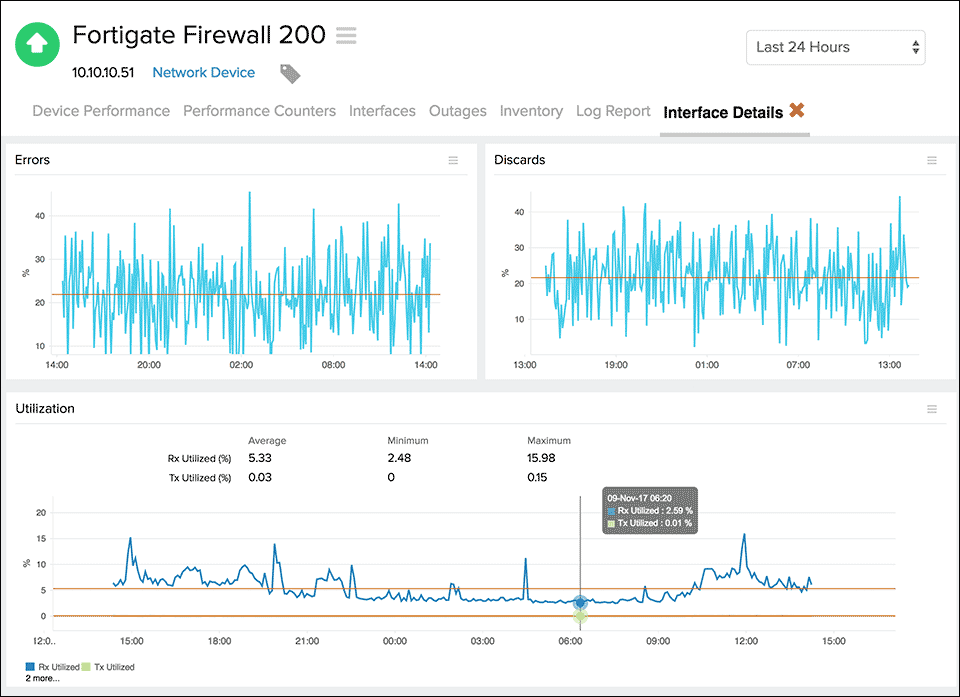
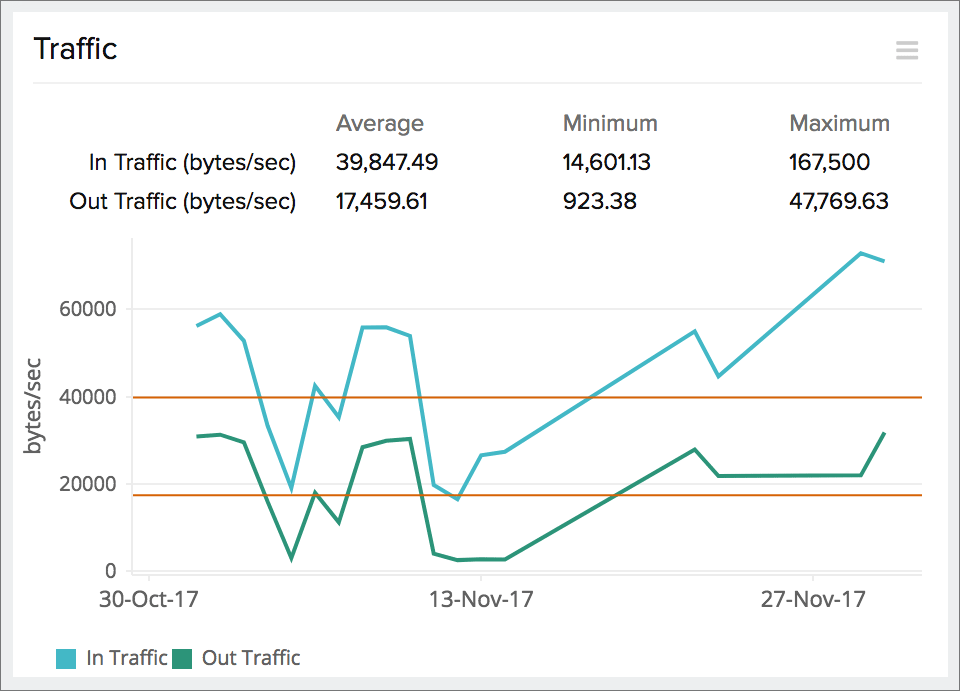
Be it a Fortigate router or a firewall—monitor it comprehensively with detailed stats on their status, availability, and performance. With the automatic discovery, all you have to do is just connect to your devices' SNMP MIBs to get started. You can oversee the traffic and all the required performance metrics at the interface level.
With over 10,000 default device templates, Fortinet performance monitoring has never been more thorough. Stay on top of outages with instant alerts on your mobile device for complete Fortinet network management.
Monitor Fortigate firewalls and other network appliances with Site24x7's full-fledged virtual private network (VPN) monitoring.

Fortinet performance monitoring metrics
Bandwidth Metrics
- Big buffer hits
- Big buffer misses
- Buffer create failures
- Buffer failures
- Drop events statistics
- Medium buffer hits
- Medium buffer misses
- Open socket (s)
- Small buffer hits
- Small buffer misses
- Total huge buffer hits
- Total huge buffer misses
- Total large buffer hits
- Total large buffer misses
- Total number of collisions
CPU Metrics
- CPU usage (one-minute average)
- CPU usage (five-minute average)
- CPU usage (five-second average)
- CPU utilization
- CPU utilization (WLC)
- Firewall CPU utilization
- Switch CPU utilization (five-minute average)
Interface Metrics
- Aborted interfaces in packets
- Backplane utilization
- Ignored interface (s) in packets
- Input packet drops
- Interface collisions
- Interface in CRC errors
- Interface in giants
- Interface in runts
- Interface input bits
- Interface output bits
- Interface reset count
Memory Metrics
- Disk utilization
- Free 1550K buffers
- Free 256K buffers
- Free 4K buffers
- Free 80K buffers
- Free memory
- Jabber packets
- Largest free memory
- Memory utilization
- Memory utilization (WLC)
- Number of fragments
- Output packet drops
- Oversized packets
- Packets received
- Packets to BC address
- Packets to MC address
- Router memory utilization
- Switch memory utilization
- Tunnel in-drop packets
- Tunnel in-octet
- Tunnel in-packets
- Tunnel out-drop packets
- Tunnel out-octet
- Tunnel out-packets
- Undersized packets
- Used memory
Other Metrics
- Active session count
- Associated mobile stations
- Associated mobile user (s)
- IronPort temperature
- Mail transfer threads
- Outstanding DNS requests
- Pending DNS requests
- Temperature (WLC)
- Total number of octets
Out-of-the-box support for Fortinet devices
In addition to supporting the following Fortinet devices, you can monitor 'n' number of them by creating custom device templates.
- Fortigate Firewall 1000A
- Fortigate Firewall 100A
- Fortigate Firewall 200
- Fortigate Firewall 200A
- Fortigate Firewall 200B
- Fortigate Firewall 300
- Fortigate Firewall 300A
- Fortigate Firewall 3600
- Fortigate Firewall 3600A
- Fortigate Firewall 400A
- Fortigate Firewall 500A
- Fortigate Firewall 50A
- Fortigate Firewall 60
- Fortigate Firewall 800
- Fortinet FortiAnalyzer 400-C
- Fortinet Fortigate 100E
- Fortinet Fortigate 1200D
- Fortinet Fortigate 300D
- Fortinet Fortigate 3700D
- Fortinet Fortigate 500
- Fortinet Fortigate 5001D
- Fortinet Fortigate 800D
- Fortinet Fortigate 900D
- Fortinet Fortigate FGT100A
- Fortinet Fortigate FGT200
- Fortinet Fortigate FGT2000
- Fortinet Fortigate FGT200A
- Fortinet Fortigate FGT3600
- Fortinet Fortigate FGT3600A
- Fortinet Fortigate FGT4000
- Fortinet Fortigate FGT400A
- Fortinet Fortigate FGT5000
- Fortinet Fortigate FGT5002A
- Fortinet Fortigate FGT5004
- Fortinet Fortigate FGT5005
- Fortinet Fortigate FGT500A
- Fortinet Fortigate FGT50A
- Fortinet Fortigate FGT50AM
- Fortinet Fortigate FGT50B
- Fortinet Fortigate FGT60
- Fortinet Fortigate FGT60C
- Fortinet Fortigate FGT800
- Fortinet Fortigate FGT81E
- Fortinet Fortigate FGT90DPOE
- Fortinet Fortigate FGTONE
- Fortinet Fortigate FGTVM
- Fortinet Fortigate FGTVM64
- Fortinet Fortigate FGTVM64XEN
- Fortinet Fortigate Firewall Log Collector
- Fortigate Router 3140B
- Fortigate Router 500
- Fortinet FortiSwitch 5003A
How Site24x7 monitors Fortinet devices?
- Automatically discovers SNMP devices by connecting to its MIB.
- Chooses from over 10,000 default templates or allows you to customize based on your requirements.
- Thoroughly monitors key metrics at the interface level.
- Allows you to add over 100 performance counters of your choice.
- Sends processed SNMP trap messages from your devices.
- Creates layer 2 maps and topology maps.
- Sends prompt alerts about downtime.
- Displays graphs of key performance stats.
- Generates predefined and customizable reports.

Get more than just performance data
Scalability
Scales to monitor thousands of network devices
Network Discovery
Add multiple devices at once using an IP range
Alerts and Reports
Get timely downtime alerts, and view reports with graphs
High Availability
Ensure high network availability by optimizing bandwidth allocation