What is real user monitoring?
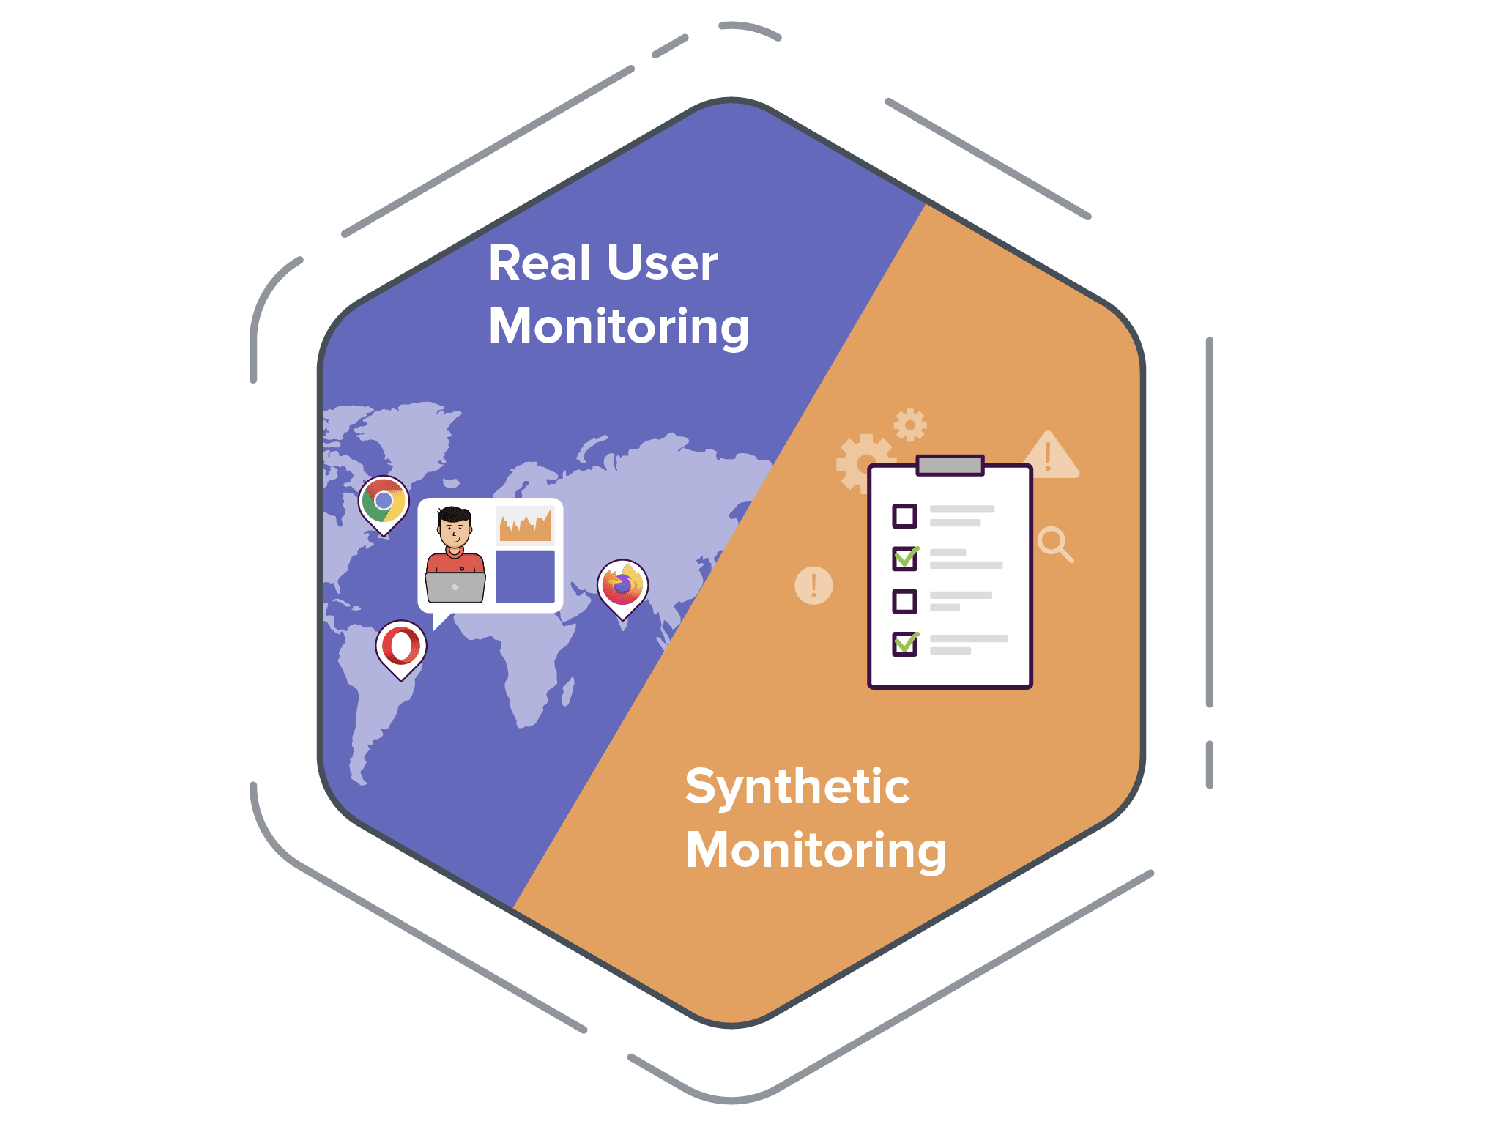
Real user monitoring (RUM) is a performance measurement process that tracks and analyzes the interactions of real users with a web application. It monitors various metrics and behaviors to gain insights into user experience, performance, and potential issues. Unlike synthetic monitoring, which simulates user behavior, RUM gathers data directly from actual user sessions, providing a real-time view of how users experience your website or application.
RUM collects metrics such as page load times, response times, and user interactions, enabling developers and IT teams to identify performance bottlenecks and issues that may affect user satisfaction. It offers valuable information about different browsers, devices, and geographic locations, helping teams understand how various factors impact performance.
With RUM metrics, organizations can make informed decisions to enhance user experience, optimize application performance, and ultimately drive user engagement. It plays a crucial role in ensuring that applications run smoothly for end users, leading to better retention and satisfaction.
How does RUM work?
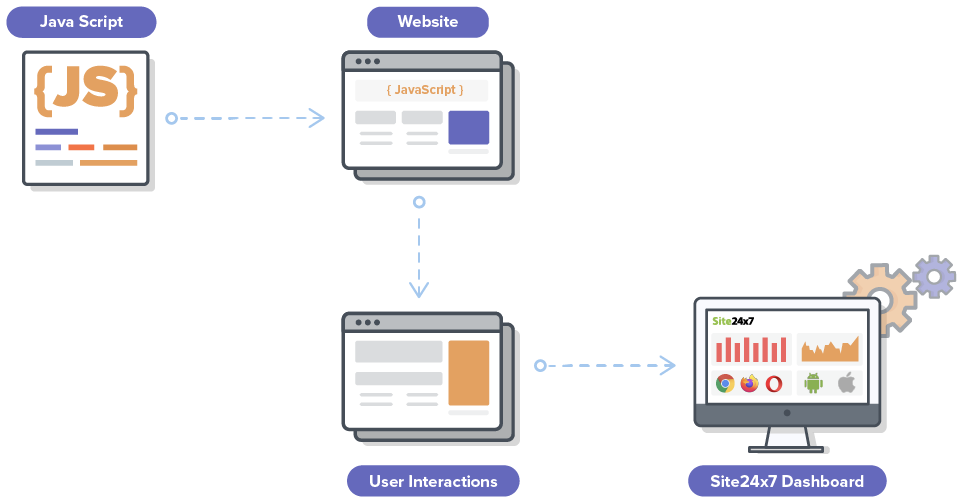
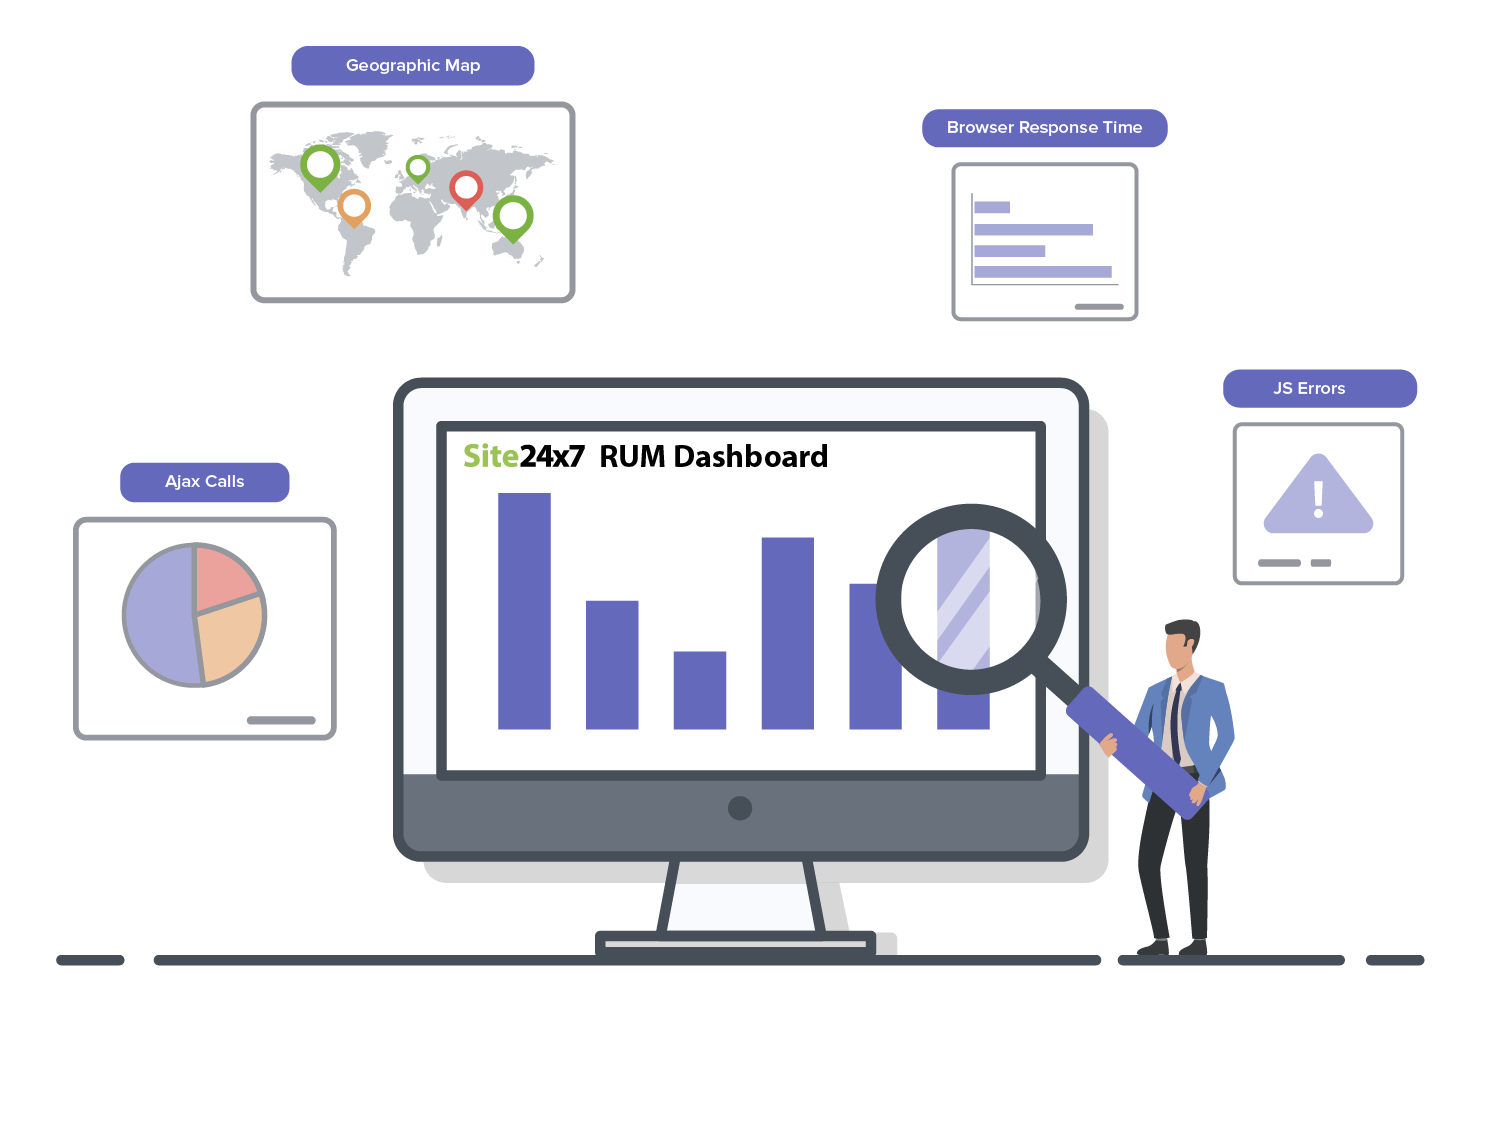
A small JavaScript code is injected into the website's header or footer. This in turn injects a script that helps in capturing all the performance data when the webpage loads. Metrics like redirection time; the number of JavaScript errors, AJAX calls, and user sessions; DNS lookup time; connection time; network time; backend time; and frontend time are captured.

Key metrics of RUM
RUM tracks and analyzes real-time performance of your websites based on user interactions and the different aspects of user experience.
- Performance metrics: RUM collects client-side performance data, resource load times and overall webpage performance, and helps analyze your critical data, including core web vitals and golden signals.
- Apdex measures a user’s satisfaction with the response time of your web applications.
- User interaction metrics:
- User interaction events: Tracking clicks, scrolls, and other interactions.
- Session duration: Length of time a user spends on the site.
- Error metrics: Common javascript errors, their occurrences, and their associated stack traces.
- User context metrics:
- Geographic data: Location information of users.
- Device and browser performance: Performance variations across devices and browsers.
- Network conditions: Insights into connection types.
- User journey tracking: Paths users take through the site, including entry and exit points.
- Transaction times: Get insights into the length of each user transaction.
These metrics help in analyzing and understanding different aspects of user experience and application performance effectively.
RUM vs. synthetic monitoring
RUM and synthetic monitoring are both used to assess application performance, but they employ different data collection methods and provide unique insights.
| RUM | Synthetic monitoring | |
|---|---|---|
| How it collects data | Monitors actual user interactions. | Simulates user interactions. |
| What it's best for | Understanding long-term trends. | Identifying and addressing short-term performance issues. |
| Benefits | Captures performance across devices, browsers, networks, and geographic locations. | Can be used to monitor at every stage of development in a controlled environment. |
| Considerations | Requires traffic for generating data. | Challenging to assess all the unpredictable factors that influence situations in real time. |
Together, RUM and synthetic monitoring track a variety of metrics that identify potential patterns and anomalies, providing crucial insights for analyzing the digital experience of users. When combined with an application performance monitoring (APM) tool, you can gain full visibility of your application's performance across the entire stack.

Benefits of RUM
- Real-time insights: RUM provides immediate data on how actual users interact with your application, allowing for quick identification of issues.
- User experience optimization: Analyzing real user behavior helps in identifying areas for improvement, thereby enhancing overall user satisfaction.
- Performance metrics: RUM metrics provides insight into critical elements such as load times, response times, and interaction events, helping teams understand performance from the user's perspective.
- Device and browser analysis: RUM offers insights into how different devices, browsers, and operating systems impact performance, enabling targeted optimizations.
- Identifying bottlenecks: RUM helps detect performance bottlenecks and potential issues that could disrupt the user experience.
- Data-driven decisions: RUM data helps you make informed decisions about application enhancements and resource allocation.
- Improved retention and engagement: By enhancing user experience, RUM can lead to higher retention rates and increased user engagement.
- Comprehensive coverage: RUM data is captured from all real user interactions, providing a complete picture of application performance across various conditions.
Key features of RUM
-
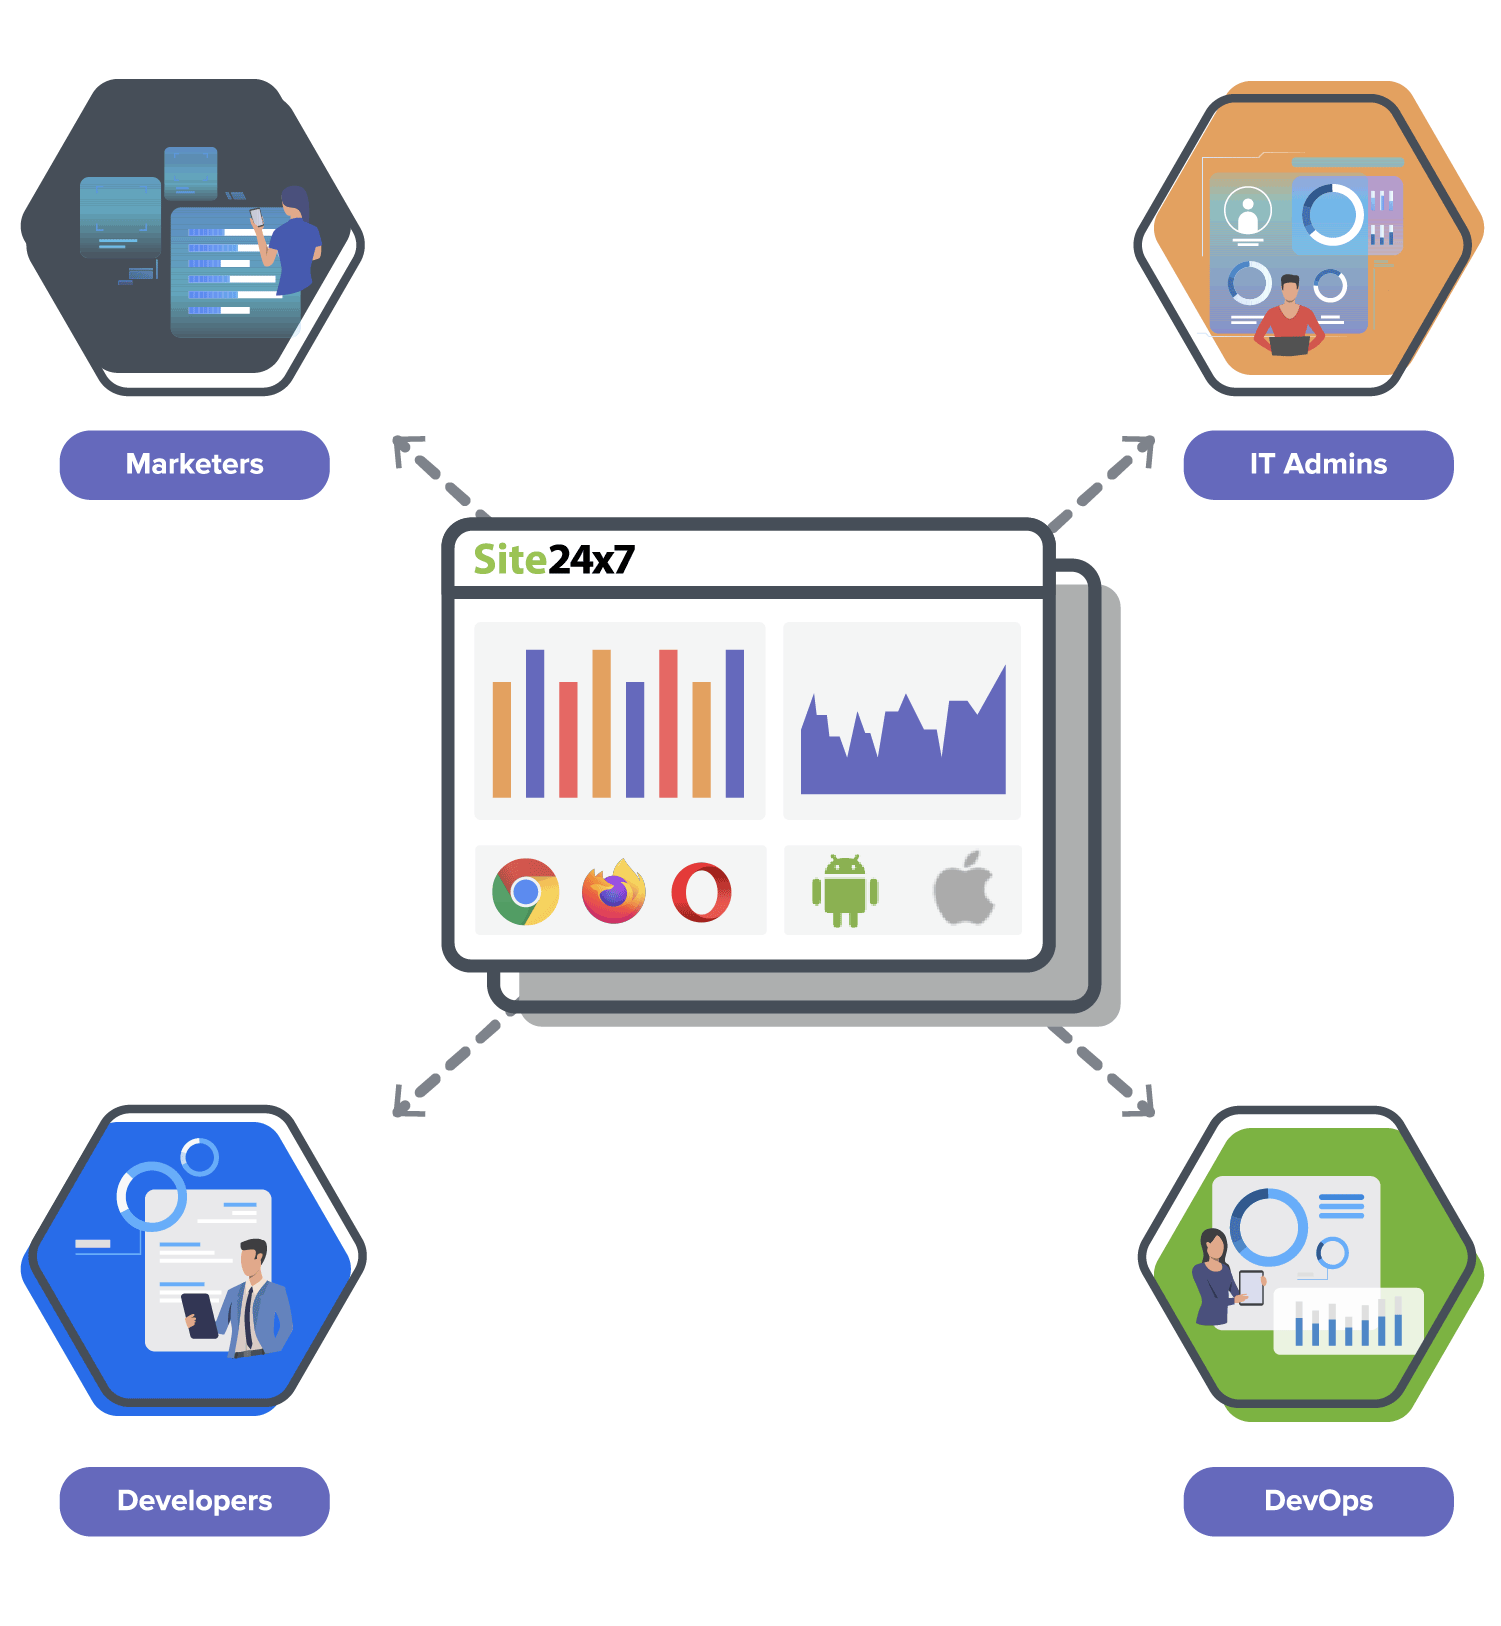
RUM is used by people in various roles, including developers, DevOps, IT admins, and marketers.
-
Monitor the performance of single-page applications (SPAs): Static HTML pages are outdated, and SPAs are the rage these days. Tracking asynchronous calls in SPAs, a crucial task for organizations, can be achieved with RUM.
-
Analyze user sessions: Monitor user journeys and analyze the reasons a user exited or abandoned a page.
-
Identify and eliminate JavaScript errors: Pinpoint the exact URL and line of code where a JavaScript error has occurred. You can also trace the user paths contributing to a specific error and analyze the possible triggers.
-
Analyze webpage performance: Identify response time and throughput for individual webpages, as well as load time for resources like images, CSS, and scripts, and optimize them accordingly.
-
Track browser performance: Certain issues, like JavaScript errors, can be browser-specific. With RUM, you can identify and eliminate them as well.

Tools for real user monitoring
RUM enables real-time user monitoring and provides essential insights into your website's performance by tracking actual user interactions. They offer critical metrics like page load times, network latency, and server response times, helping you identify issues such as JavaScript errors and AJAX performance. Site24x7's RUM tool enables monitoring of single-page applications (SPAs) and offers enhanced visualization with filterable performance analysis. With AI-powered alerts, you can gain full visibility into the user journey and optimize the digital experience using our observability platform.
Who uses RUM?
RUM is used by people in various roles, including developers, DevOps, IT admins, and marketers.
- Developers:
Developers are interested in how an individual webpage loads for different end users. RUM sheds light on the different factors contributing to page load time: network attributes, content downloaded for each user, front-end resources consumed for rendering the downloaded content, platform compatibility, and JavaScript errors.
- DevOps:
DevOps teams are interested in how their infrastructure caters to end users of all sorts. RUM helps DevOps teams determine if a spike in response time can be attributed to expected factors (increase in traffic, poor performance in a particular geography) or to unexpected factors (issues with the ISP or CDN).
- IT admins:
RUM gives IT admins a holistic, granular view of front-end performance, including network latency, errors, and user sessions.
- Marketing:
RUM helps marketers dig deep into performance by geography, identify busy hours, and analyze specific pages of importance.
