Product security focuses on protecting the customer environment as much as our own IT environment. Site24x7 is an observability platform with variety of components including cloud application, servers, agents, alerting and reporting modules. To keep things secure and keep a check on all the running components, we rely on our Log Monitoring tool AppLogs, which serves as a centralized console for all our Application tracing needs.
Key challenges in security
The Site24x7 RED Team faces the following challenges :
- Monitoring security for Site24x7 infrastructure is difficult because of the increase in the number of components, technologies, and applications.
- Security analytics is becoming more of a data problem than a security problem. We need to analyze terabytes of data in near real-time to monitor log data across all components.
- Run time monitoring and trend analysis of what is happening across the different components of Site24x7 is a big challenge.
- Each component in Site24x7 uses different technologies and log formats. Lack of centralized log monitoring that can scale horizontally and accept various log types and custom ones leads to lack of visibility.
How does it work?
All the Site24x7 Production Servers are installed with the Site24x7 Server Monitoring Agent that collects logs from individual applications. These are then pushed to the Site24x7 AppLogs Engine, which provides near real-time monitoring and insights on any malicious activity happening in our systems.
AppLogs enable us to have a centralized view of logs across all the modules across different Data Centers like Reporting module, Alerting Module, and Cassandra, and bring them in a single Site24x7 pane.

How do we accomplish real-time monitoring and alerting?

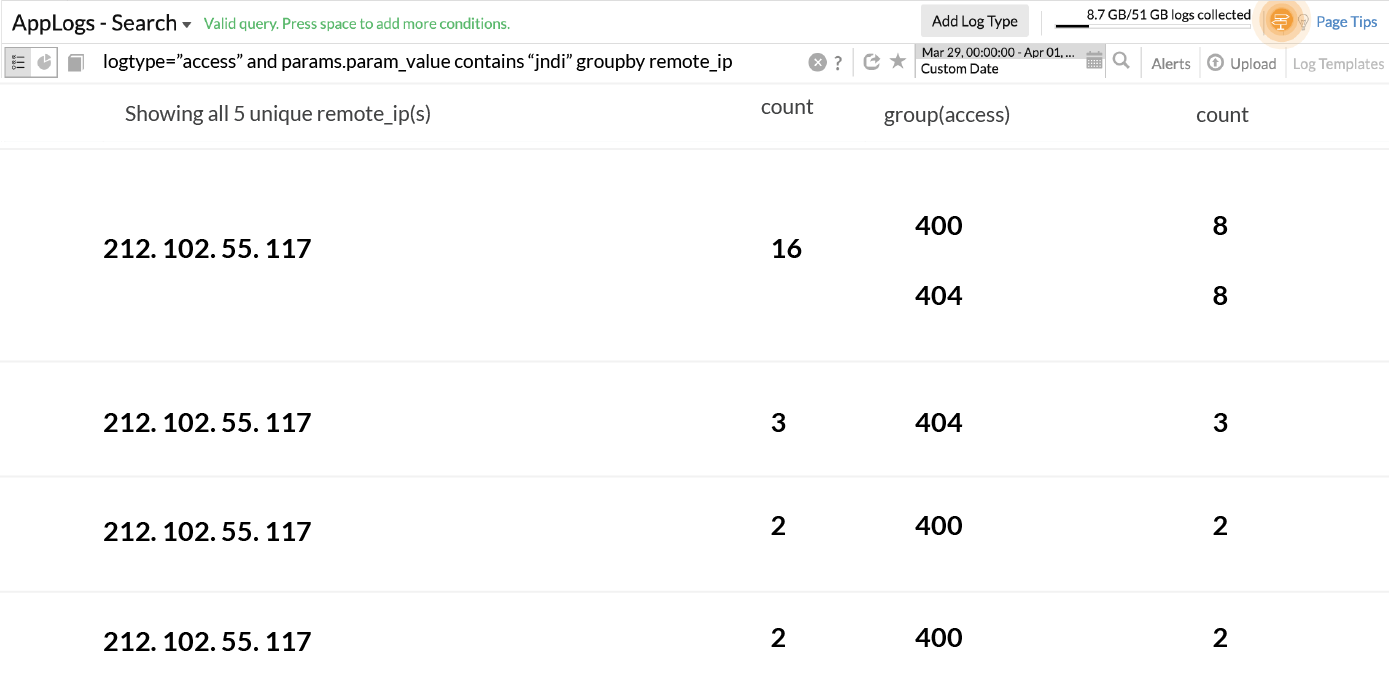
Let's take the case of a Log4shell issue. Though we are not directly affected, a lot of attack attempts were made on our product, and we can still see some activity with vulnerable payloads. Our Web Application Firewall is configured with strict whitelist-based filters and every parameter has to pass through this filter for the API to succeed. We can check a real-time view of this, and an alert to be triggered when a malicious payload request is confirmed.
From the screenshot, you can infer that we've used a search query to find the results which contain the "jndi" payload, and grouped them by the response status code and remote IP address. None of the response code is "200" and we are safe, as none of the requests went through application firewall. We can also set up an alerting for this, which will monitor the logs for this vulnerable payload with status code "200" every five minutes for count > 1, and it can alert the security team immediately for further analysis in the applications logs.
How do we accomplish real-time monitoring and alerting?
Assume the condition above has triggered an alert for the security team. Now it's the responsibility of the security team to verify whether this alert inflicted any damage. For this, we can link the above Access Log to the Application Log so that it's possible to find the application behavior of the request under investigation.
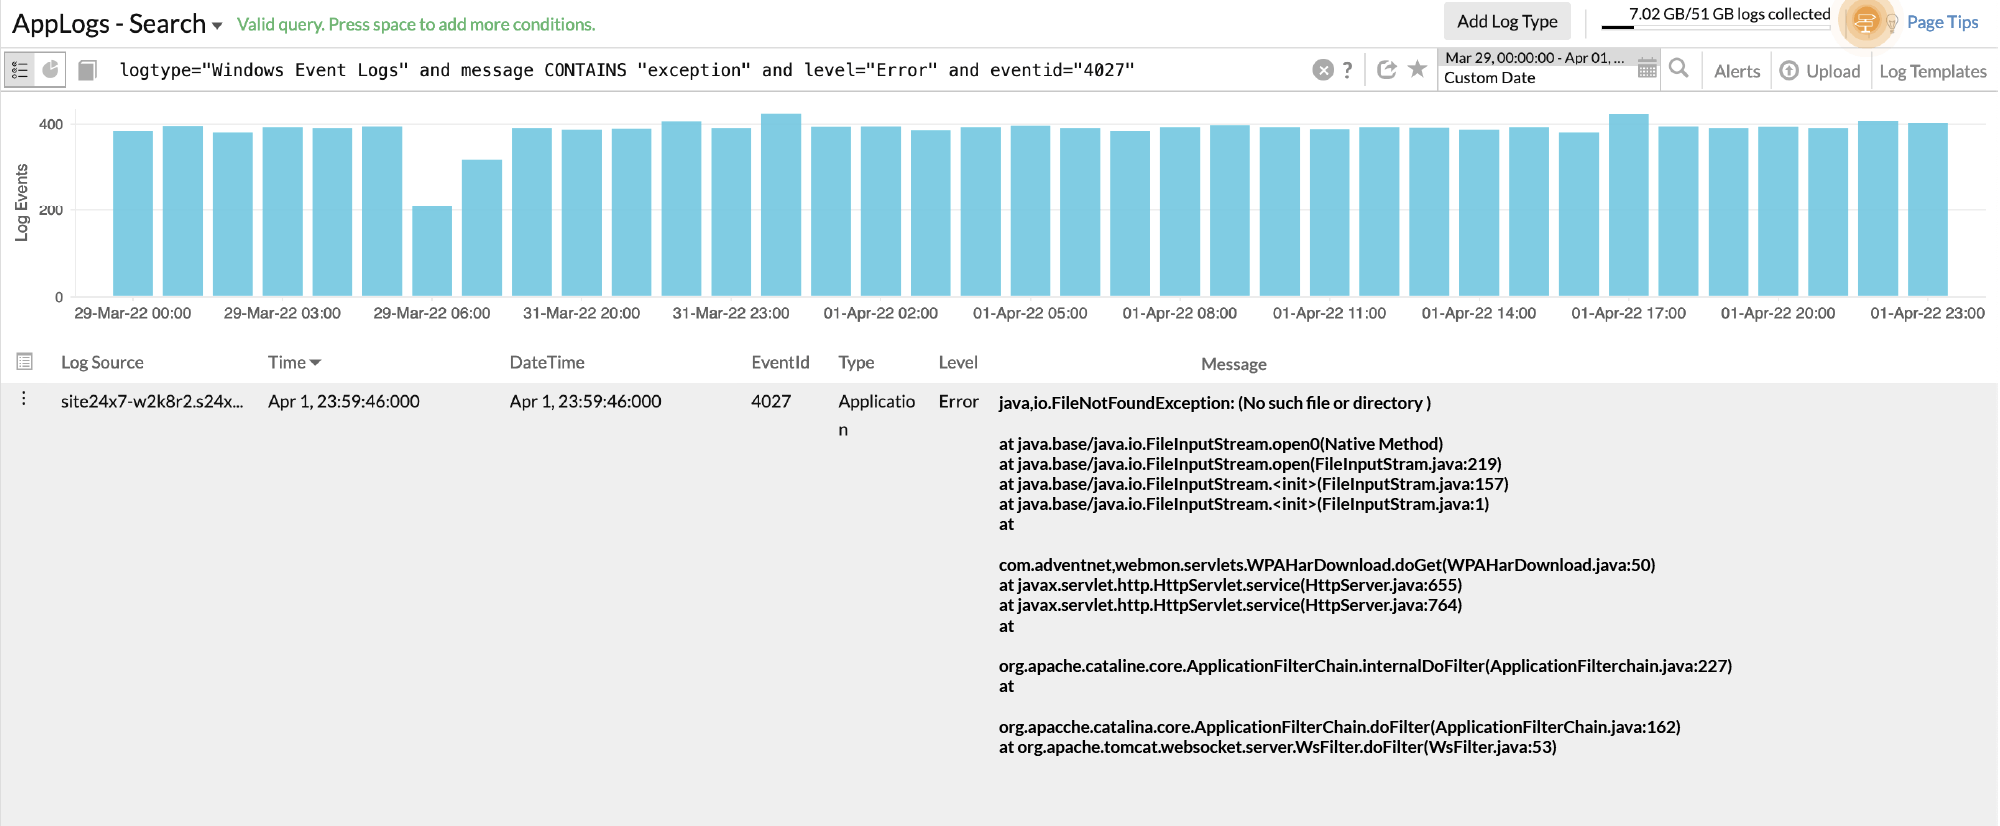
For instance, in one of our recent internal hacking experiments, which occur throughout the year, we received an alert indicating the Path traversal payload has bypassed the Web Application Firewall and received a "200" response. Now it's our responsibility to investigate this issue and find out whether the request was able to read a file. The application logs linked to the access logs were analyzed and we received the results shown in the screenshot below.

In the screenshot above, we found the exact trace for the bypassed request that has tried to read the file from the server. Since the file is not present in the server, the file read was not possible.
It's worth running an incident response analysis of this request and checking whether anyone, an external or an internal attacker, was able to read a file successfully. We have performed a full-fledged scan of the URL requested above in our logs with this vulnerable payload and which has passed the Application firewall. Fortunately, all the requests were from a single remote IP which belonged to our internal hacker.
Conclusion
Using the Shift Left approach to detect and prevent security incidents in the development environment is a great strategy to secure your products. But having good visibility into your environment and having real-time monitoring in your environment is more important. Attack attempts are happening to every organization on a daily basis, but it's important to know when the attempt is successful. Proactively terminating the incident can only be possible if you have a holistic view of the components, and monitoring what is happening in each of the components. Site24x7 AppLogs enables you to understand all your components with powerful query-based search, real-time alerting, tracing, and reporting.