What is StatsD?
StatsD, originally a daemon written by Etsy's Erik Kastner, is a standard that can be used to send, collect, and aggregate custom metrics from any application. Today, the term StatsD refers to both the protocol used in the original daemon as well as a collection of software and services that implement this protocol.
Some of the factors that set StatsD apart from other alternative methods for capturing metrics are the fact that it is simple, efficient, and straightforward to write and read. It cannot crash your app because the daemon runs outside the app and UDP protocol is used, can be implemented in all the languages, even run on the same server or remotely, and has zero overhead.

Complete StatsD Monitoring
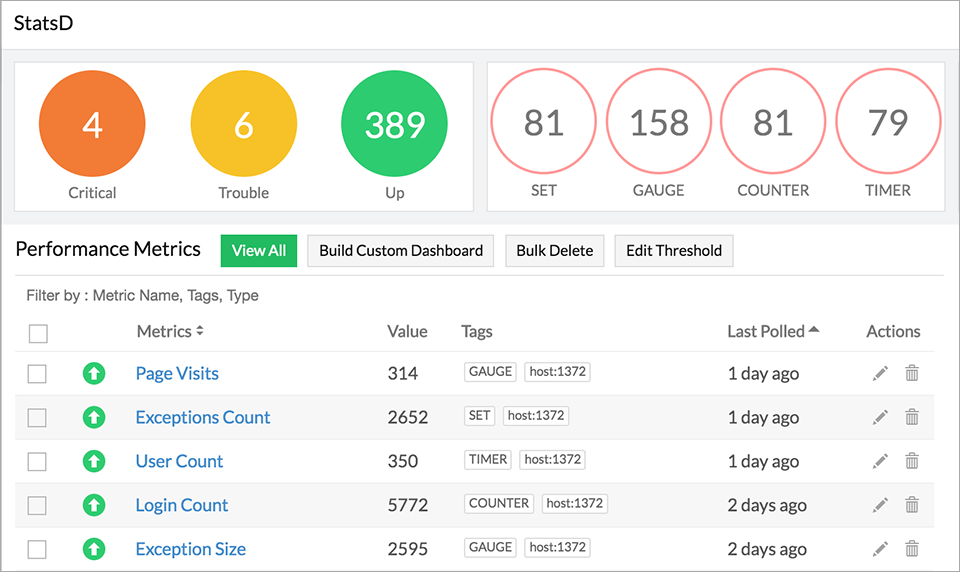
Get a real-time visibility into key performance metric types like Timer, Counter, Gauge, and Set. Easily configure, analyze, and visualize your application performance from a single console.

Dimensional data and Tagging
Compare and visualize metrics across different dimensions, and across applications. Automatically tag metrics, visualize, and compare them filtering by name, tags, and type.

Custom Dashboards
Build personalized dashboard views by customizing it with dynamic widgets. Get individual metrics performance and trends, all in one place.
Alerting and Reporting
Set-up instant alerts and get notified if values cross pre-defined threshold levels. Get Strategy and Trouble/Critical alerts for individual metric and other performance attributes.
IT Automation & Auto Recovery
Automatically execute event-driven remote actions, remediate threshold breaches, and auto-resolve performance and availability issues with IT Automation.
Third-party Integrations
Integrate with a variety of third-party apps and obtain a bird's-eye view of performance across departments by amalgamating data from varied sources.
How it works
A lightweight StatsD client / interface / listener in the server monitoring agent collects and aggregates metrics. This allows easy collection of custom application metrics in Site24x7.


Analyze StatsD performance.
Collect and correlate custom metrics through the Site24x7 agent which will aggregate all metrics and update the web client, set-up thresholds and alerts, build customized dashboard, and view application performance from a single console. Get in-depth visibility into the performance, availability, and usage stats of applications, take informed troubleshooting decisions by keeping track of critical metrics including Health, Gauges count, Counter count, Timer count, and more.
The complete tool to solve all your monitoring needs
Prometheus Monitoring
Acquire better visibility and an integrated view into your applications and servers.
Learn moreServer Monitoring
Monitor your entire server infrastructure with over 60 performance metrics.
Learn morePlugin Integrations
Get visibility across your entire infrastructure with our 100+ integrations.
Learn more
