How does Site24x7 monitor Nutanix?
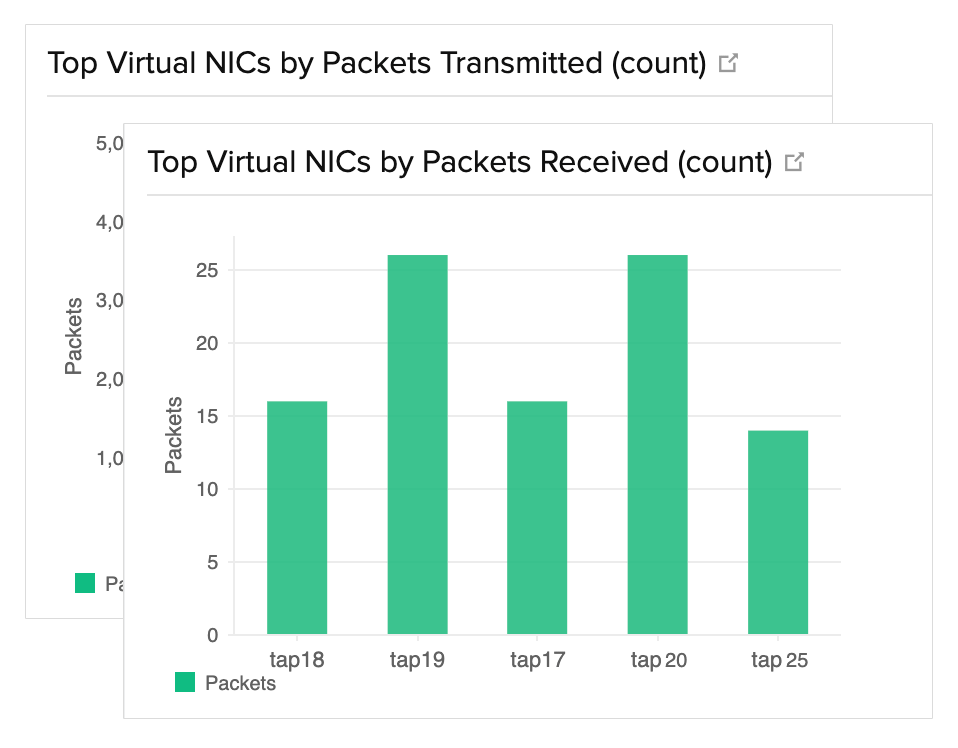
Nutanix monitoring is a unified monitoring of the performance of all Nutanix resources and processes with timely alerting of issues. The Site24x7 On-Premise collects the monitoring data from Nutanix APIs and processes the data. You can then view different data in formats like graphs, charts, dashboards, and reports, that are easy to analyze.

Complete monitoring of Nutanix stack and supported infrastructure
Automatically discover the hosts and VMs associated with your cluster, and monitor the infrastructure at every node. With real-time data from the Nutanix Acropolis hypervisor, stay on top of your Nutanix environment with Site24x7's single-console monitoring.
Plan your resources
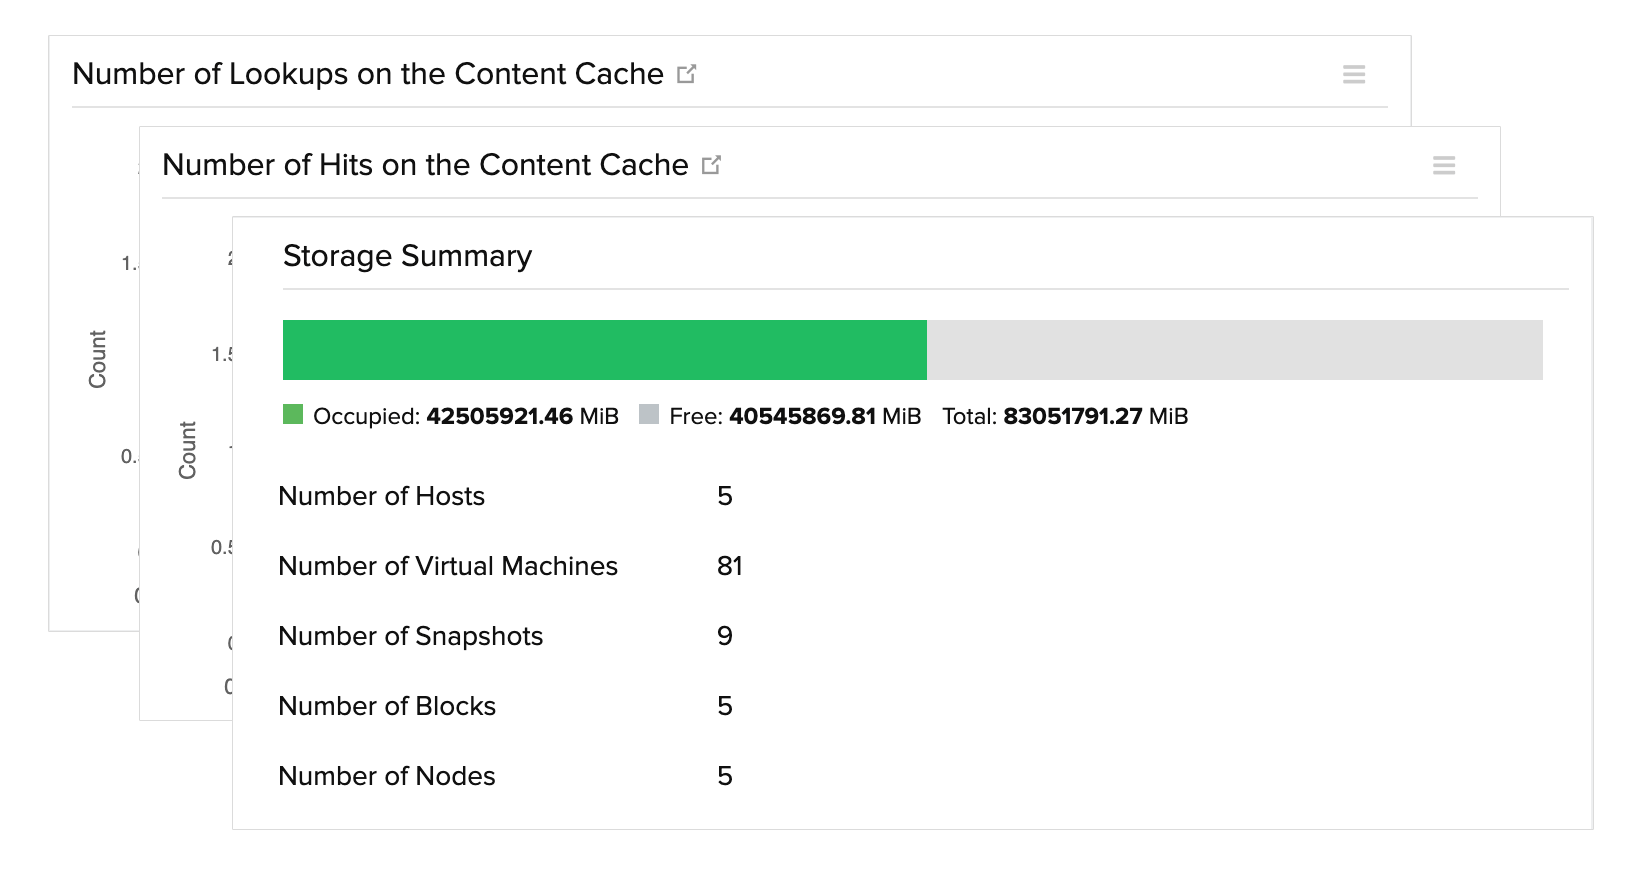
With metrics like data transferred from the storage controller, disk, hypervisor, memory saved from deduplication of content cache, and memory used to cache data, perform proper capacity planning for your RAM and storage requirements across resources.
Identify usage trends
View the usage trends for different resources from different platforms in different timelines. Easily capture performance peaks and slopes using intuitive graphs. You can also hand-pick and view your key performance indicators (KPIs) on a custom dashboard for easy analysis.
Obtain granular performance insights
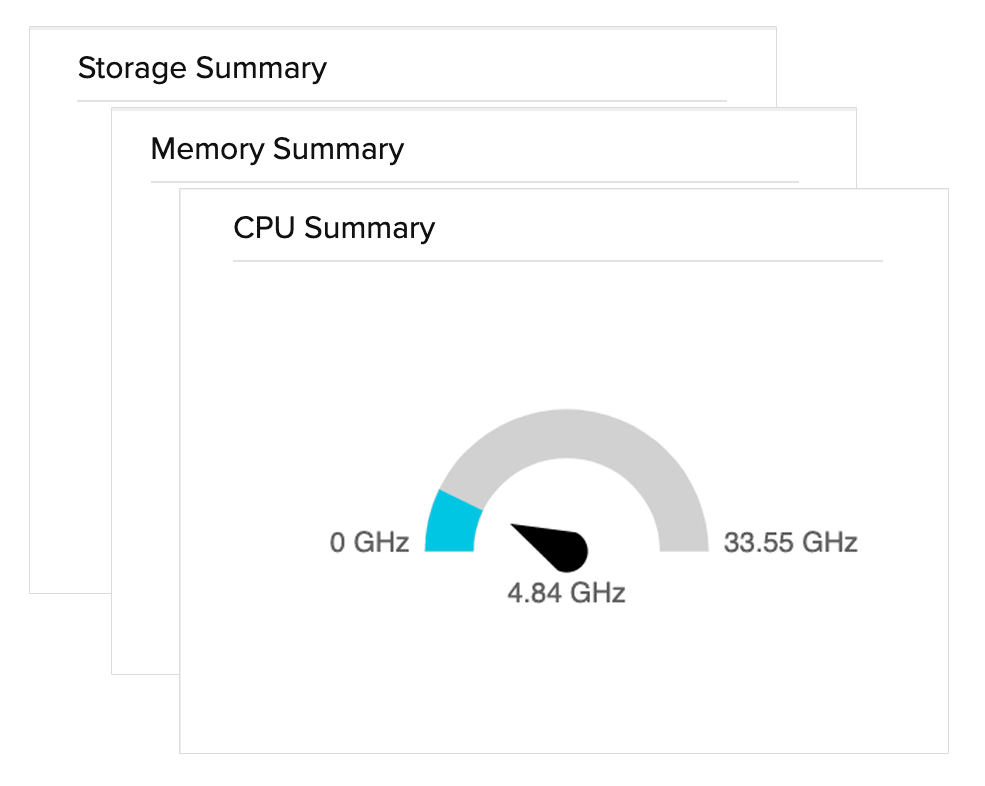
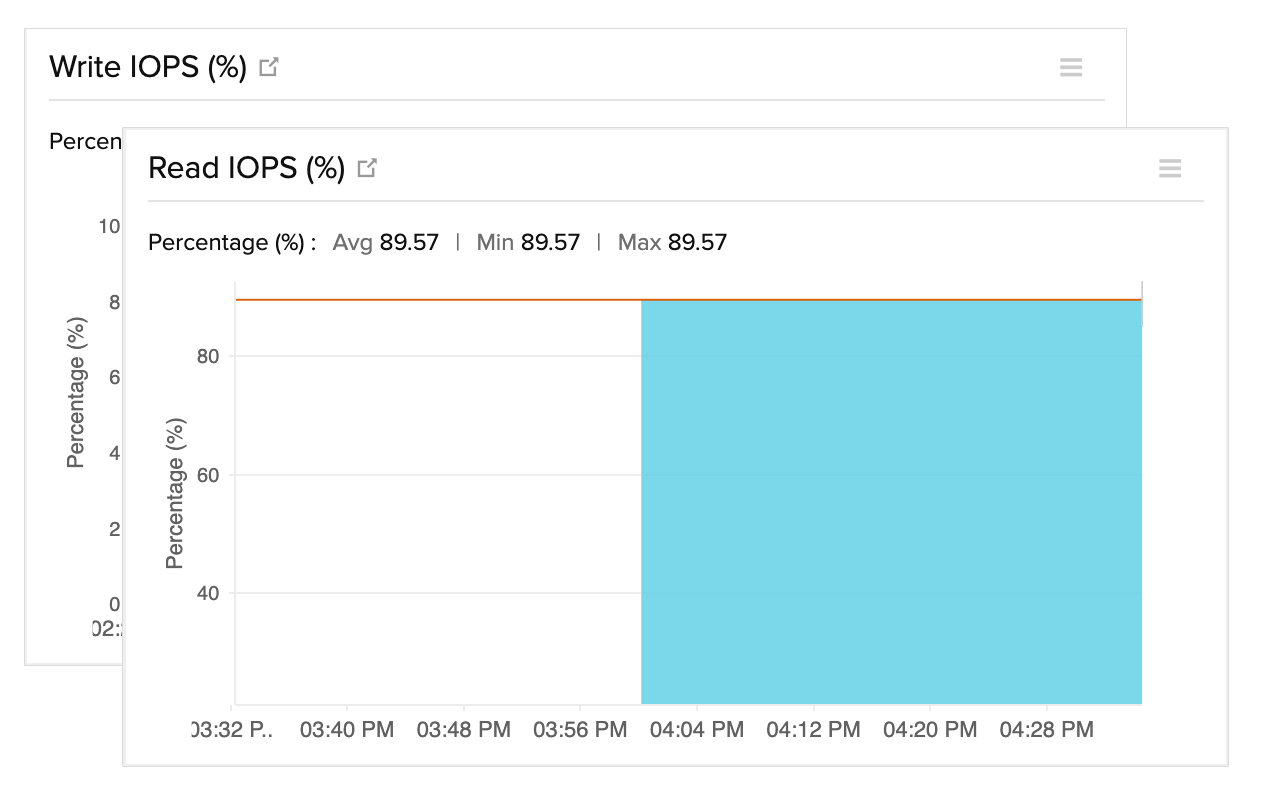
Optimize and right-size your HCI with performance insights on metrics like disk usage, input-output operations, latencies, and more. Manage the end-to-end performance with category-wise data for every resource using Site24x7's Nutanix Acropolis monitoring.
Configure thresholds and alerts
Set threshold limits for all monitored metrics, including the child-level metrics of storage containers, virtual disks, and virtual NICs and avoid downtime. Receive alerts when your resources are in trouble, critical, and down states through various sources like voice call, SMS, email, and third-party tools like Slack and Microsoft Teams.
