Check the health and availability of your Linux servers for optimal performance with Site24x7's Linux monitoring tool.
Top 7 Linux performance commands for system administrators
There are a handful of key Linux commands that system administrators use daily to monitor the performance of their computers and servers, debug performance issues, and to predict and avoid performance bottlenecks.
In this article, we’ll look at seven commands that will help you monitor CPU and memory usage, disk I/O operations, network activity, port configuration, and a lot more. These commands allow you to easily identify and kill processes that consume more resources than expected and cause performance issues. We’ll also take a closer look at the syntax and various options available so we can better understand these commands.
Even if you’re not a system administrator, learning these commands can help you better understand what's happening with your computer.
1. top
top is one of the most frequently used commands by system administrators. At a very high level, the command shows the system uptime, CPU usage, number of threads, memory usage (total, used, free, etc.), a list of running processes, and much more. Figure 1 shows a screenshot of the top user interface taken on Ubuntu 18.04.
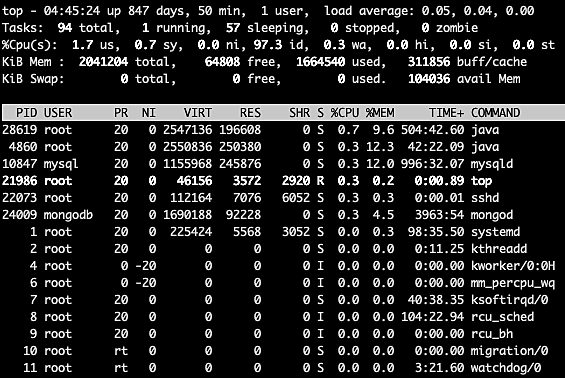 Fig. 1: top UI on Ubuntu
Figure 1 shows that there’s a lot of information here, and a lot of options to filter the task list, kill processes, sort the list, and more. For example, we can sort the task list by the %CPU or %MEM columns to easily find out which processes are consuming the most CPU or most memory. Use these commands to sort tasks by memory or CPU percentage:
top -o +%MEM
top -o +%CPU
Figure 2 shows the processes sorted by the percentage of memory used in descending order.
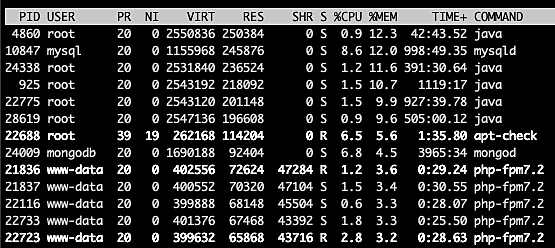 Fig. 2: Task area sorted by percentage of memory used
Sorting by CPU usage or memory consumption lets us identify processes that could be causing performance issues. We can then easily kill those processes from the same top user interface.
2. vmstat
vmstat tells us everything we need to know about virtual memory. The system starts using virtual memory when it runs out of physical memory. Therefore, to start with, virtual memory will always be zero. Along with virtual memory stats, vmstat gives us a lot more information about system processes, interrupts, block I/O operations, disks, paging, CPU scheduling, and more.
Figure 3 shows the output of vmstat without any options passed. The command is:
vmstat
 Fig. 3: vmstat output
As you can see, it's not as dense as the top UI. But with just a few options, we can still get all the information we need. For example, passing the option a gives us the active and inactive memory info, as shown in figure 4. The command is:
vmstat -a
 Fig. 4: vmstat -a output
Passing the option s will give us all the information we need about CPU scheduling, as seen from figure 5. The command is:
vmstat -s
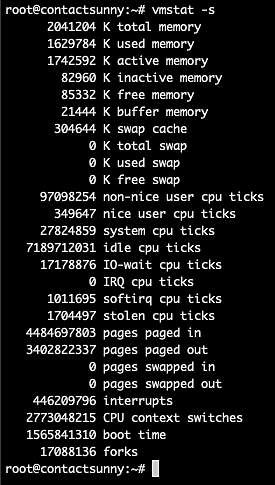 Fig. 5: vmstat -s output
3. lsof
In Linux, everything depends on files. For example, the network adapters—and even any USB accessory that we plug in—are all controlled using files. So, any issues with hardware, or even software on a Linux machine has to be debugged using files. lsof (or list of open files) is a handy command to quickly see the list of open files and associated processes.
Figure 6 shows a truncated list of the lsof command output. This table gives us a lot of information, including the command used to run the process that owns the file, the PID, the user who owns the process, the type and size of the file, and more.
 Fig. 6: lsof output
We can use various options with the command to filter files for a particular user, or by files used by a certain port, and so on. These include:
- Command to filter files by owner:
lsof -u root - Command to filter files of processes listening to a certain port:
lsof -i TCP:22
Figure 7 shows the list of files opened and owned by the user root.
 Fig. 7: lsof with user filter
4. tcpdump
To debug network issues, or to check traffic of any specific app or service on machines, use the command, tcpdump. Figure 8 shows a screenshot of the command’s output.
 Fig. 8: tcpdump output
As evident from the screenshot, tcpdump provides source IP, destination IP, type of protocol used, amount of bytes transferred, and more. This information is useful when trying to trace a network call or check for unusual network activity.
This command also comes in handy to check if a package or service is making calls to unauthorized hosts or IP addresses. If so, it also checks whether any unauthorized sensitive data is being shared that shouldn’t be, or see if any extra packages are being downloaded that could result in security risks.
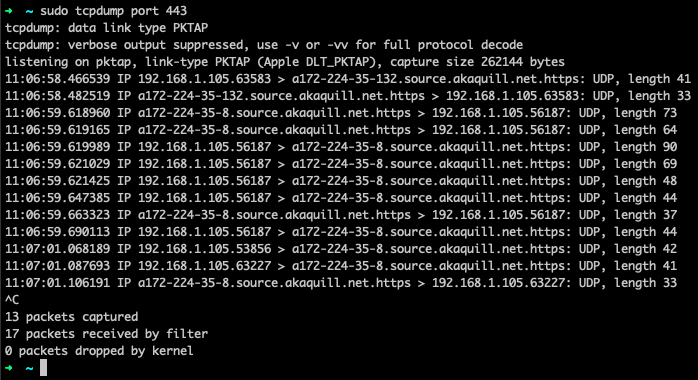 Fig. 9: tcpdump for port 443
5. netstat
netstat is a command used to identify open ports, connections to external IP addresses, and the connection status. Figure 10 shows a screenshot of the output of the command.
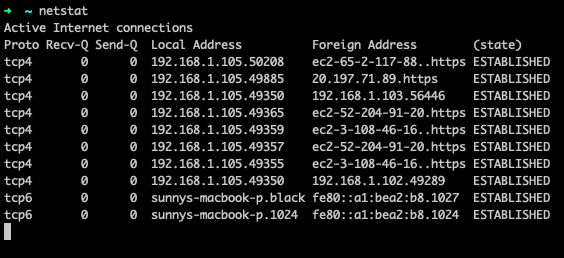 Fig. 10: netstat output
The command provides the protocol used, the local and foreign IP addresses, and also the state of the connection. This helps us find out if a process has all of its ports open, and if they’re being used or not. This can help debug many network problems.
This command also helps debug potential network security issues. There have been many reported instances of security breaches where a network port has been made open on the public internet, leading to an attack. So, whenever we install or deploy a new service, we need to ensure there are no unnecessarily open ports that might result in security risks.
Using netstat, we can also check the network routing table. The option to do so is nr, as illustrated in figure 11.
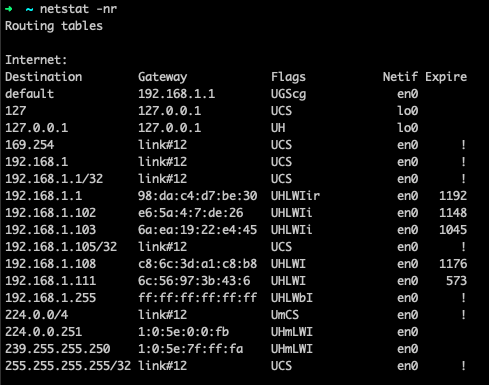 Fig. 11: netstat -nr output
6. iostat
As we’ve already mentioned, everything in a Linux computer is controlled using files. These files are written to the disks attached to the computer. Whenever a process runs, along with CPU and memory, the process also consumes disk bandwidth. In other words, every process performs a number of I/O (input/output) operations every second. And much like other resources, there's a limit to this bandwidth.
iostat is used to monitor such I/O activity on all disks and partitions on a computer. It also provides the CPU utilization for such operations. Using iostat , we can decide if we need to modify system configuration to allow for better or balanced I/O operations. Figure 12 shows the output of iostat on an Ubuntu 18.04 computer.
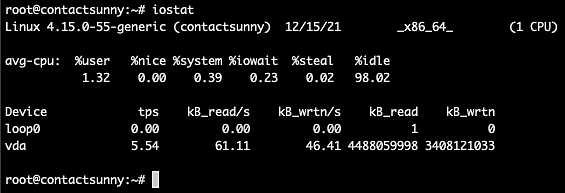 Fig. 12: iostat output
As you can see, the first section of the output is the average CPU usage divided into sections, including userspace, system space, CPU steal, CPU idle, and I/O wait. The %iowait column tells us if the CPU is wasting a lot of time waiting for I/O operations to complete. A high number here would indicate that the I/O is slow, or is being held up in some other process.
The next section lists all the devices attached to the computer, and the corresponding TPS (transfers per second), kilobytes read and write numbers, and much more. These numbers will tell us if further tuning is required to improve I/O performance.
7. iotop
Just as we would use top for monitoring processes, we can use iotop for monitoring all threads that are performing I/O operations and the bandwidth they consume.
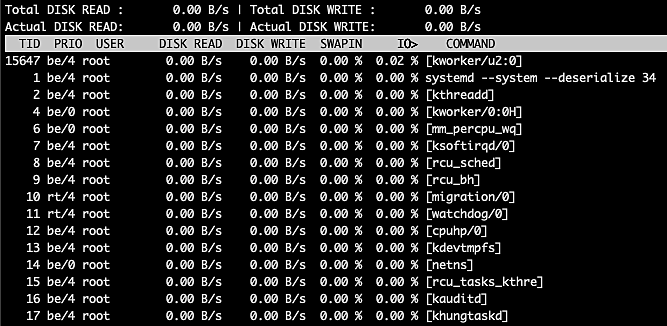 Fig. 13: iotop output
The top left section of this table gives us the total and actual disk read, while the top right section gives the total and actual disk writes. Under these sections, we have a list of threads running on the computer along with the thread ID (TID), the priority of the thread, the owner (user) of the thread, disk read and write bandwidth, percentage of time spent on swap in, percentage of time spent on I/O wait, as well as the command for the thread.
On the other hand, you will also notice that not all these threads perform I/O operations. To filter the list to show only such threads, use the option o or only, as shown below:
iotop -o
or
iotop --only
Figure 14 below shows the output of these commands.
 Fig. 14: iotop -o output
This command helps us to see the list of threads that take up too much of the I/O bandwidth and cause other threads to wait on I/O, thereby halting other processes or users.
Summary
There are powerful commands available in Linux to monitor and debug any kind of performance issues. However, merely knowing the syntax and the options of these commands is not enough. We also need to know which command to use in a given scenario. This list should provide a headstart for Linux system administrators to better understand their computers.

