Check the health and availability of your Linux servers for optimal performance with Site24x7's Linux monitoring tool.
Debugging network issues with tcpdump
System administrators routinely encounter network issues when deploying and maintaining software applications in Linux servers. Resolving these problems can be challenging and time-consuming due to several factors, including the complexity of applications, concurrent processes and services running in the server, or even having multiple processes that run simultaneously on the same processor.
We’ll discuss one of the most powerful tools for dealing with network issues: tcpdump. But before we set out to debug, we must first understand the fundamentals of the network. We’ll start with the TCP/IP model.
TCP/IP model
The TCP/IP model (short for Transmission Control Protocol/Internet Protocol) combines four different protocols deployed in networks. These protocols are four layers in the TCP/IP model:
- Application layer: The topmost layer of the TCP/IP model; it allows users to interact with services in the network.
- Transport layer: The third layer in the TCP/IP model; as its name suggests, this layer is responsible for transferring data packets between source and destination networks.
- Internet layer: The second layer in the model; it is responsible for handling any errors that may occur during the data transfer from source to destination in the network.
- Network interface layer: The lowest layer in the TCP/IP mode; it handles communication between computers and the network system via protocols like Ethernet and hardware devices such as routers.
Steps to debugging
When it comes to complex network issues, consider breaking down the steps to understand the debugging process better.
Isolate and narrow down problems
Start by understanding the problem. Debugging is made more difficult by the inherent complexity of networks and the applications using the network systems. You need to locate the exact layer where the problem occurs and you need to understand its mechanism—when and in what context it occurs.
For example, one of your testers has noticed that downloading a file from the application now takes roughly 20% more time: Download time has increased from the usual 30 seconds to 36 seconds. This is a strong indicator that there is indeed a problem somewhere in the network.
In this scenario, to isolate and narrow down the problem, you should first double-check the network’s internet connection speed. If network speed is fine, you should proceed by ruling out other issues, like network congestion, software bugs, or security issues.
Form a hypothesis
Next, you should come up with a working theory of what’s behind the network problem. Continuing with the above example, there are many potential reasons for the increase in download time.
In a hypothetical scenario, the system administration team set up a virtual private network (VPN) for the test environment of the web application. When downloading a file directly from a computer that uses the applied VPN network, you don’t encounter any performance issues. However, they do occur when running automated testing to download files in the AWS cluster. This points to a problem with the AWS cluster configuration here.
Dig deeper and find proof
After pair checking and using tcpdump for debugging the network, you find data packet loss when downloading a file from the AWS cluster. The culprit is distance: The current AWS cluster is in the us-east-2 region, whereas the local VPN is set up in Singapore.
In addition, there are unnecessary round trip requests. Each download request goes from the AWS cluster through the public internet, followed by local VPN; it is then processed by Kong (API gateway) before finally getting redirected to the AWS cluster where the downloading service is set up.
Resolve the issue
Change the domain from your automation test to the internal domain setup in the same AWS cluster—this will allow the download request to directly reach the running service in the cluster (instead of going through VPN and then back to the cluster). Download time from the AWS cluster should now take only 20 seconds.
Why use tcpdump?
Sent and received network packets provide a lot of information about the network system that can help us with troubleshooting network problems. tcpdump is a powerful tool that collects and analyzes these network packets.
If you get stuck while debugging, despite having tried a number of different tools, tcpdump might do the job. It comes with various helpful capabilities, from showing available network interfaces to analyzing captured packets related to a specific file.
For example, we can get a list of the network interfaces available in the system by running tcpdump -D
 Fig. 1: Showing available interfaces using
 tcpdump
We can then capture the data packets that are going through the eth0 network interface and save them into a file.
sudo tcpdump -w test.pcap -i eth0
 Fig. 2: Capturing network packets going through the
 eth0 interface
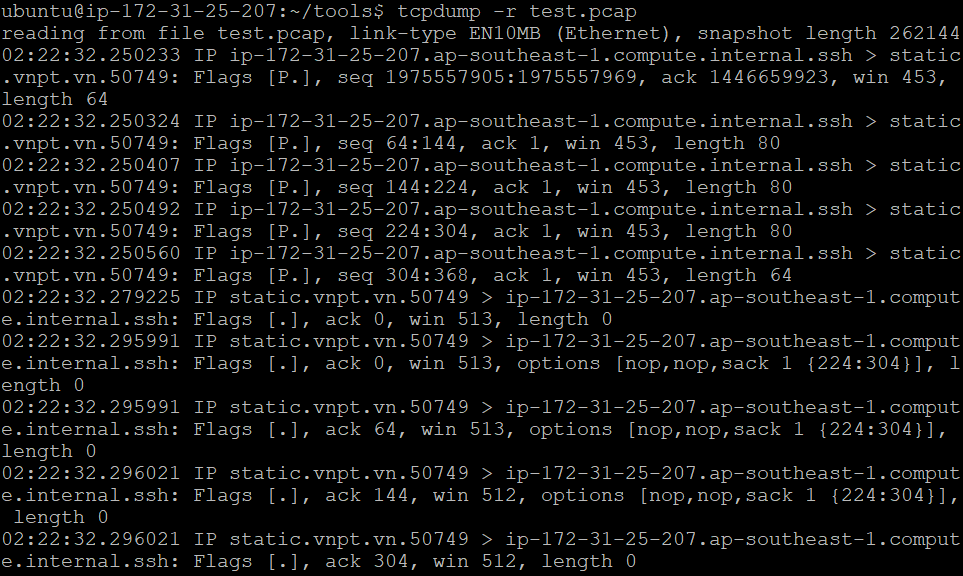
Next, to view the data captured in detail from the test.pcap saved file, we’ll run the following:
tcpdump -r test.pcap
 Fig. 3: Read network packets data from the
 test.pcap file using tcpdump
TCP flags
TCP flags show the current state of a TCP connection and are placed in the TCP header. For example, to check whether the request has finished sending data to the server, we can filter for the FIN flag in the TCP header. The commonly used flags are:
- SYN: It initiates the network connection request.
- ACK: It’s used to confirm that a certain action in the network has been approved.
- RST: It shows the connection has been terminated, due to the service network being down or not accepting any more requests.
- FIN: It indicates that the request has finished.
The benefits of using advanced tcpdump filters
TCP flags are useful for troubleshooting network issues. However, implementing a tool to capture TCP flags is complicated and involves a lot of work. Thankfully, tcpdump comes with a powerful filtering feature that makes it easy to find the packets that have a specific TCP flag or a combination of TCP flags. Moreover, we can even filter packets by IP address, network protocol, or source.
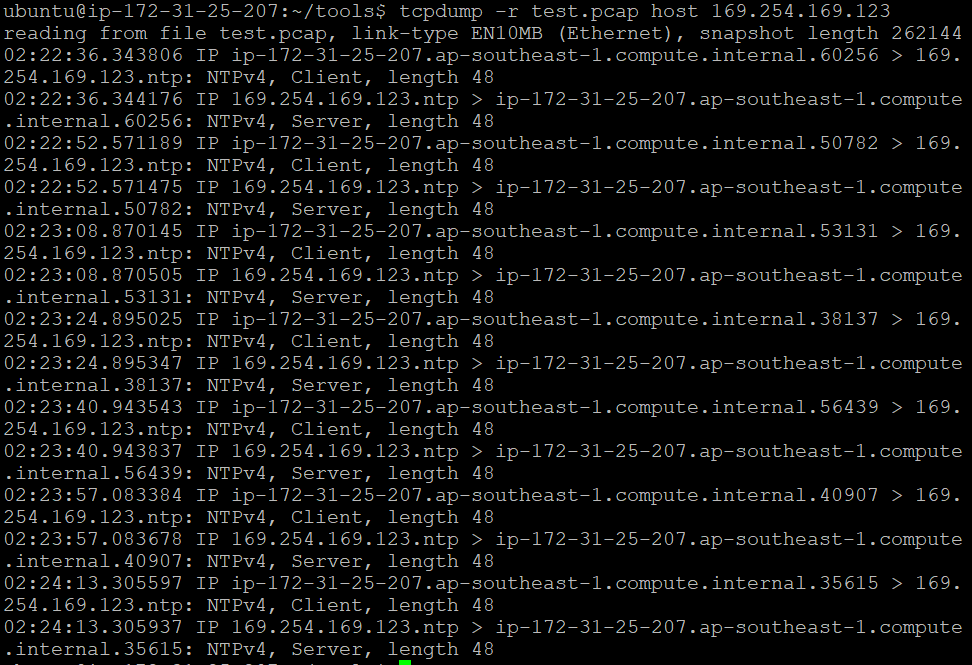
For example, we can filter the TCP packets by the IP of the host:
tcpdump -r test.pcap host 169.254.169.123
 Fig. 4:
 tcpdump filtering network packets by their host IP
Alternatively, we can filter for finished packets only:
tcpdump -r test.pcap “tcp[tcpflags] & (tcp-syn)!=0”
 Fig. 5: The
 tcpdump filter option for TCP flag displaying finished packets only
Conclusion
Troubleshooting network issues can be a daunting and time-consuming task. In this article, we’ve discussed common problems system administrators encounter in network systems and demonstrated how using tcpdump with advanced techniques like filtering TCP flags can speed up the debugging process.
Real-world troubleshooting can get quite complicated because we have a number of different services and processes running in the network system. The key to addressing these network problems effectively is to narrow down potential problems and debug each until their root cause is uncovered.

