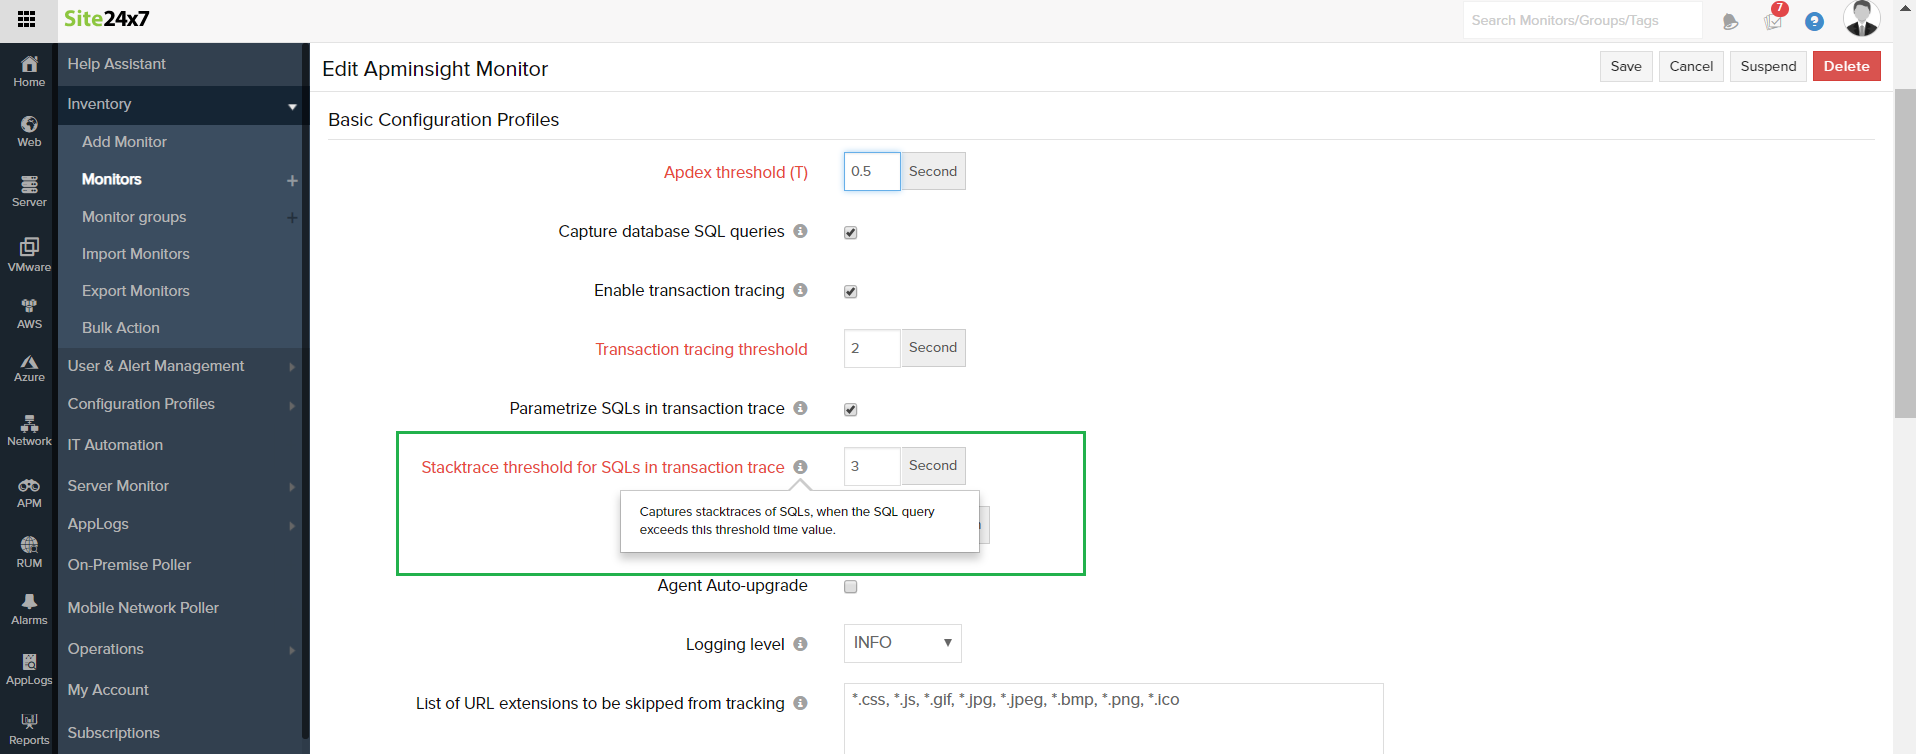
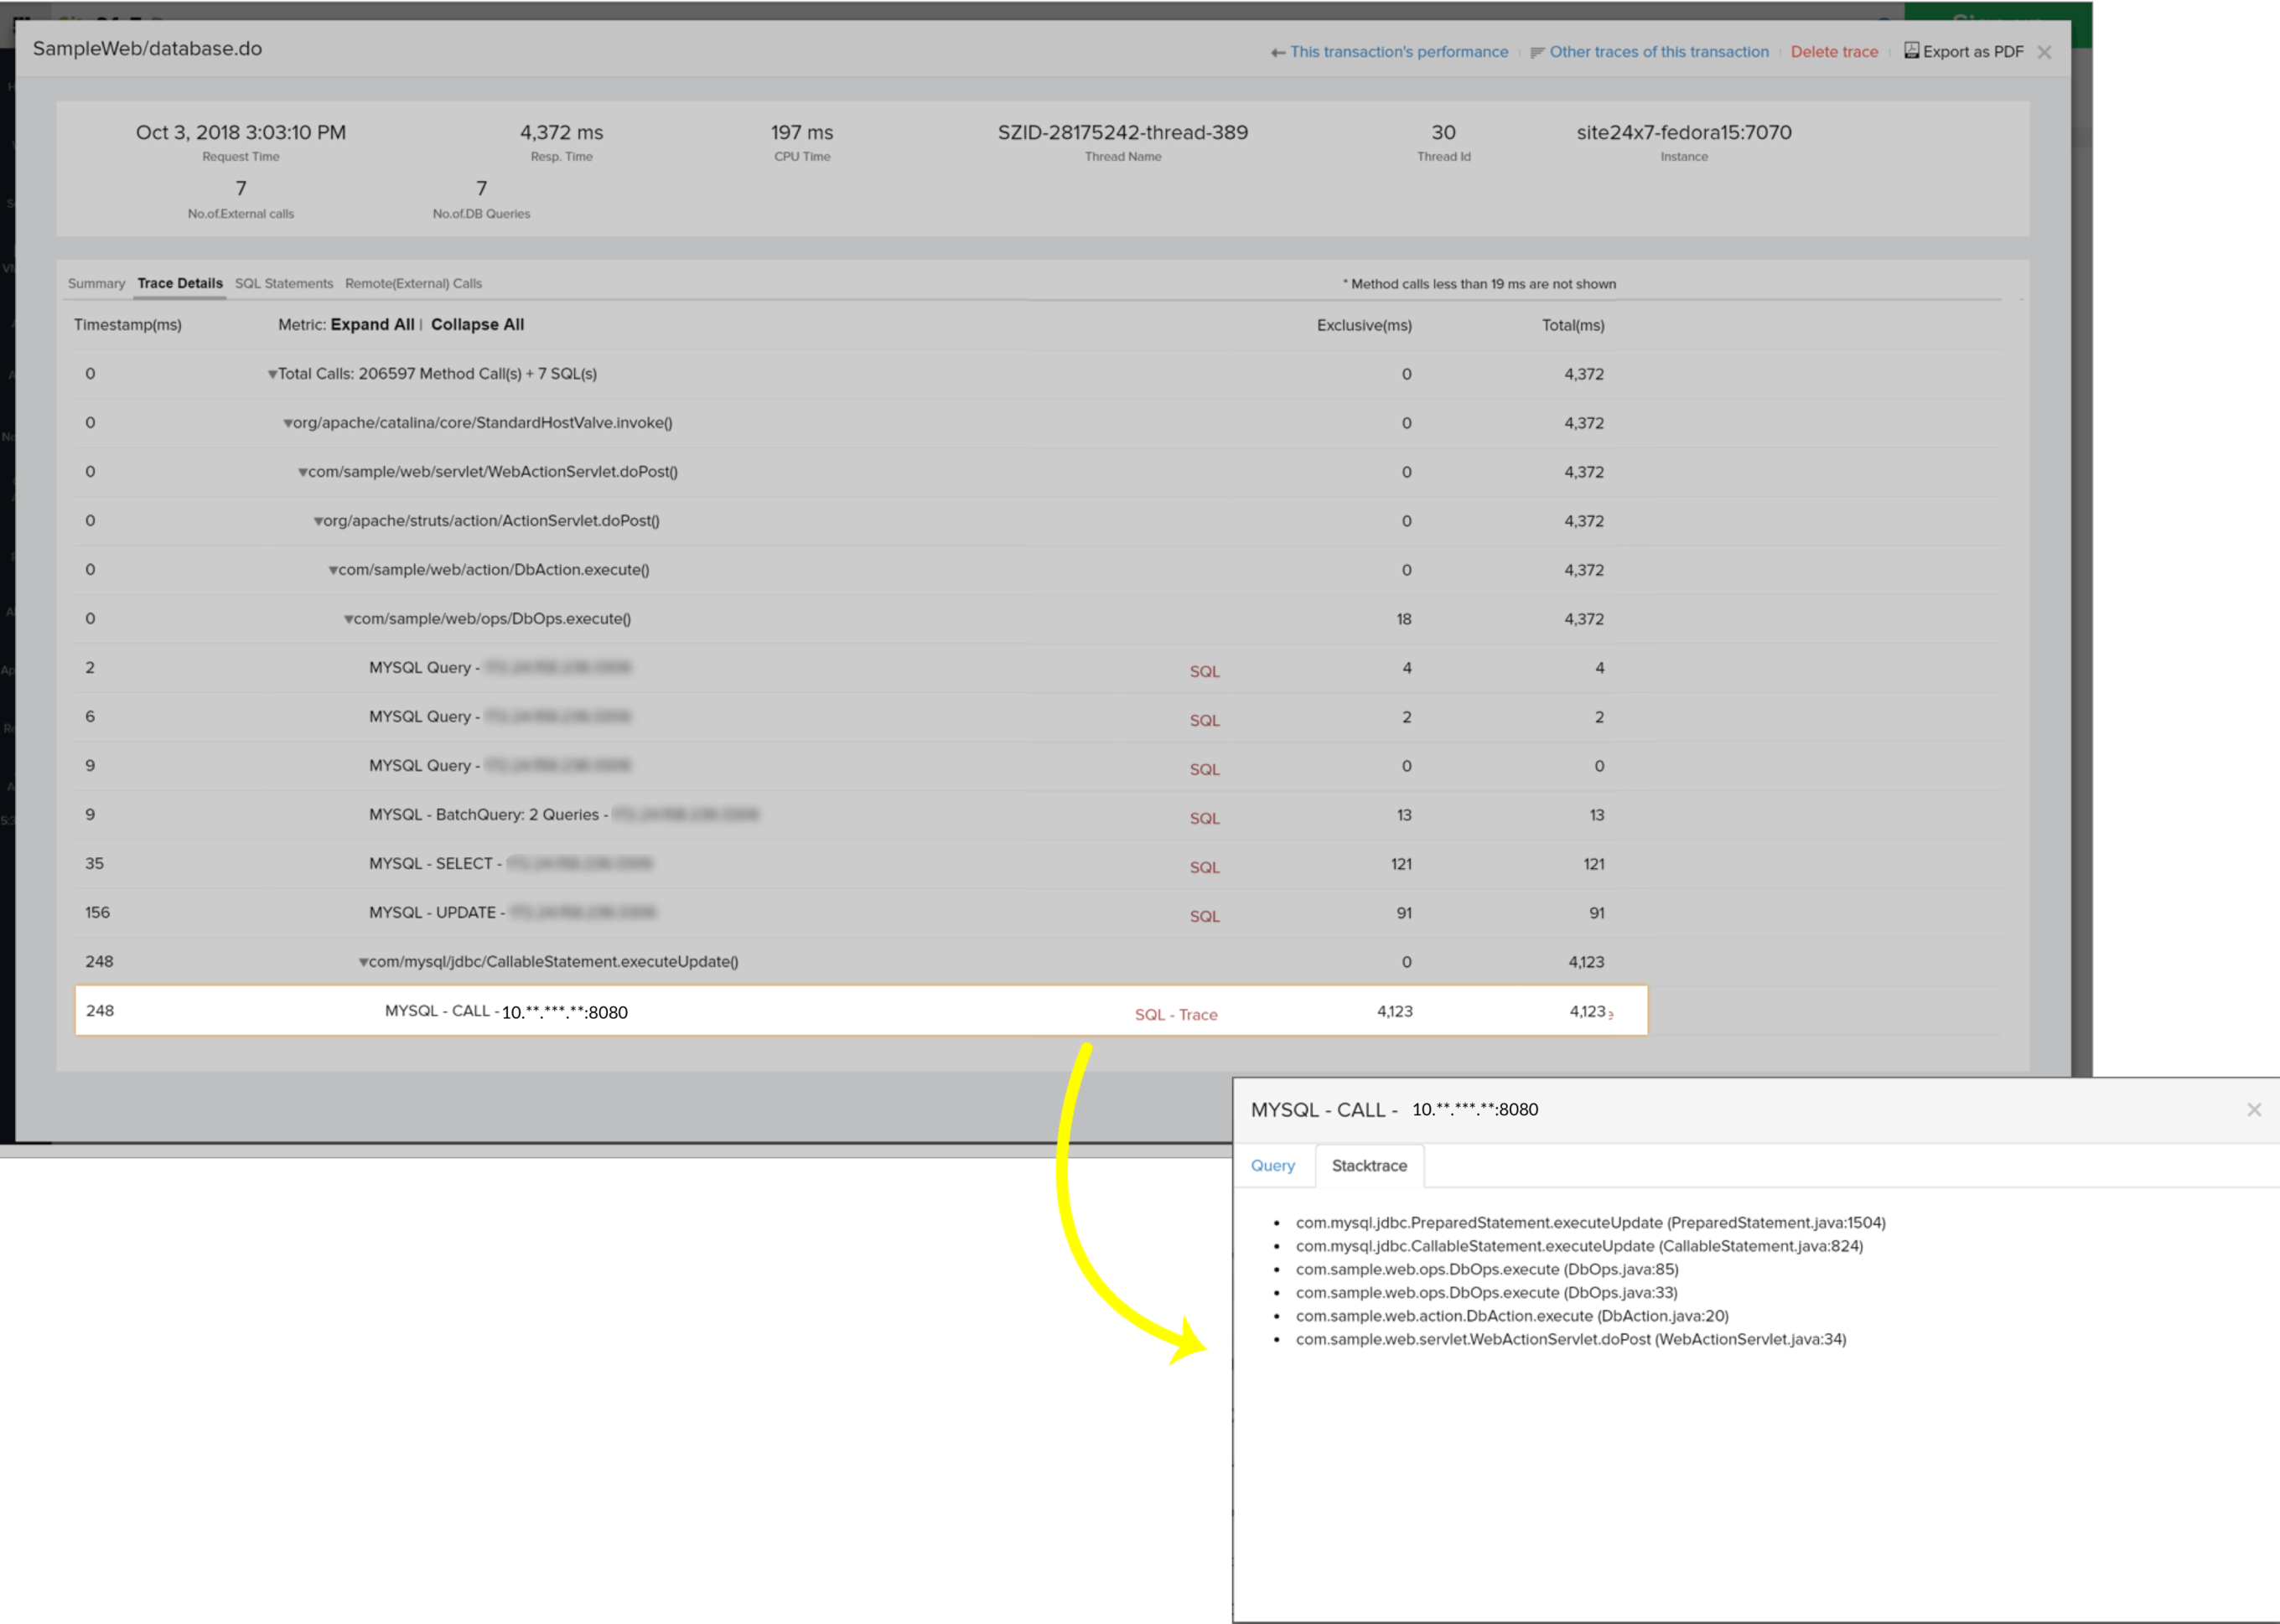
In general, whenever a transaction exceeds the specified threshold limit, its trace is captured. SQL queries involved in the corresponding transactions are also captured by default. However, to pinpoint the exact line of code causing a problem, you need the stack trace of SQL queries. You can get the stack trace by configuring the threshold value of SQL queries in the transaction trace.
By default, the threshold value of SQL queries in the transaction trace is set to three seconds. You can change this threshold to meet your requirements.

You can view the stack trace of SQL queries under the Trace Details tab of the trace.

Like (1)
Reply
Replies (0)