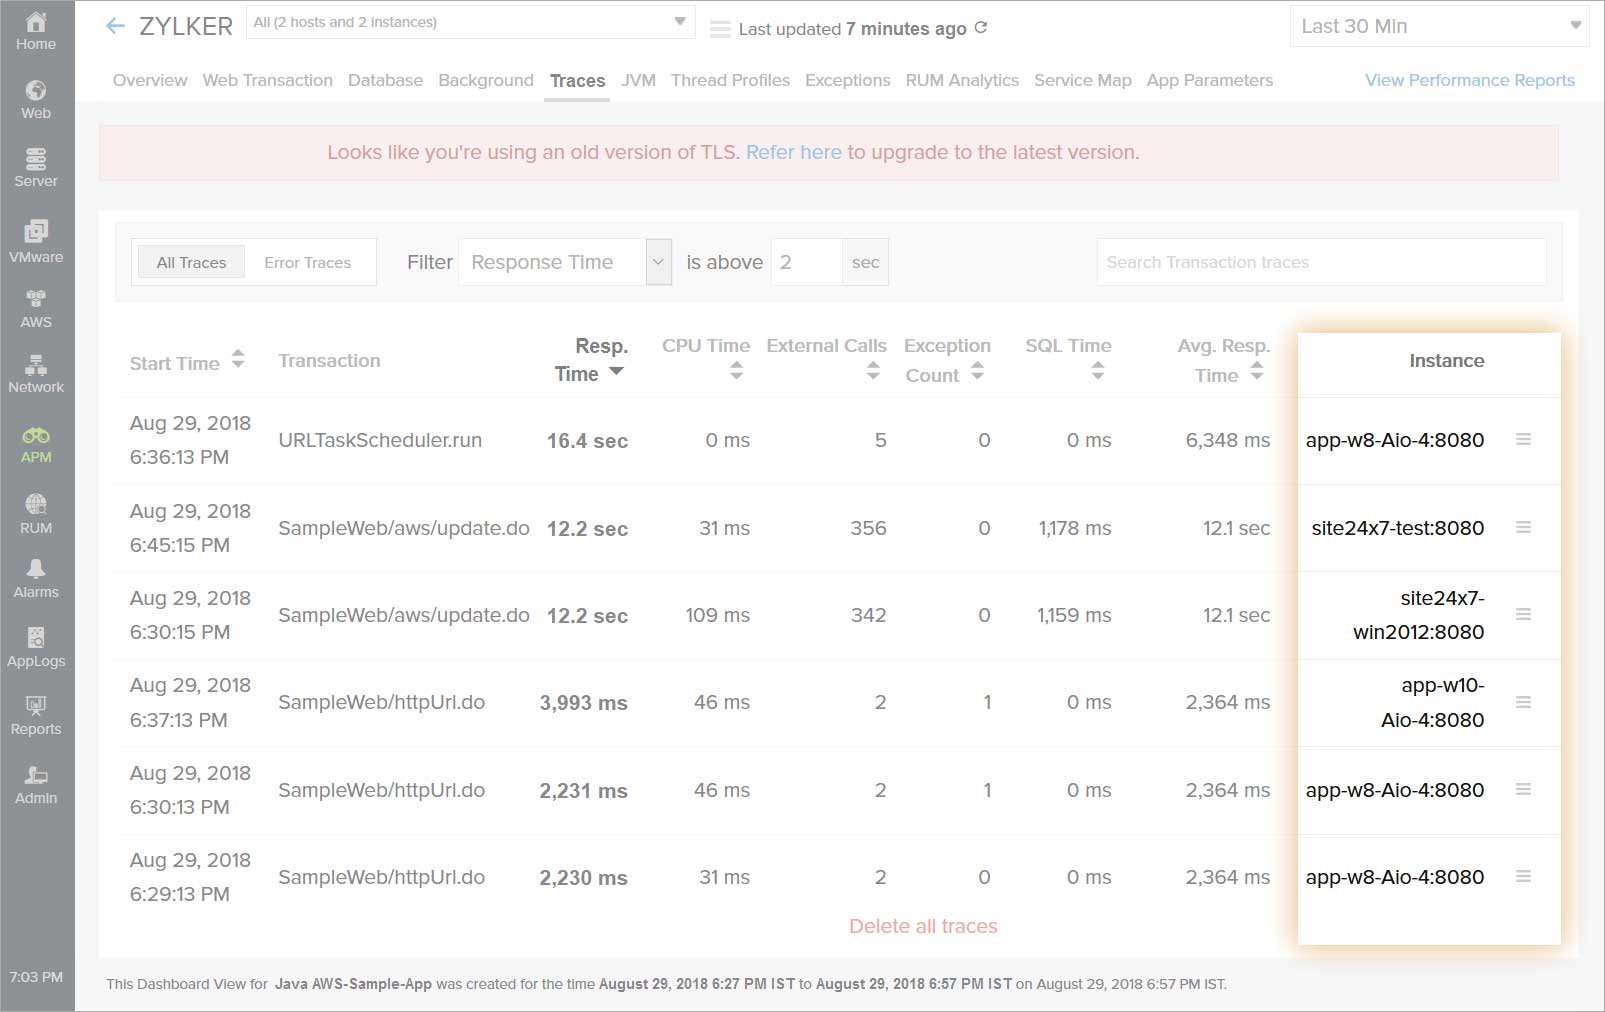
Applications often have multiple instances, and an increase in response time in one instance can cause an overall spike in your application performance. It's easy to identify the transaction that's responsible for the increase in response time. But how do you identify which instance the transaction stemmed from?
In such cases, you can easily track transactions and their traces to their respective instances using APM Insight. Every transaction trace is mapped to its instance and can be viewed under the Traces tab.

Like (1)
Reply
Replies (0)