Greetings!
We're happy to announce that we've improved the MongoDB plugin's interface and expanded its metrics, giving you deeper insights into the performance of your MongoDB database servers.
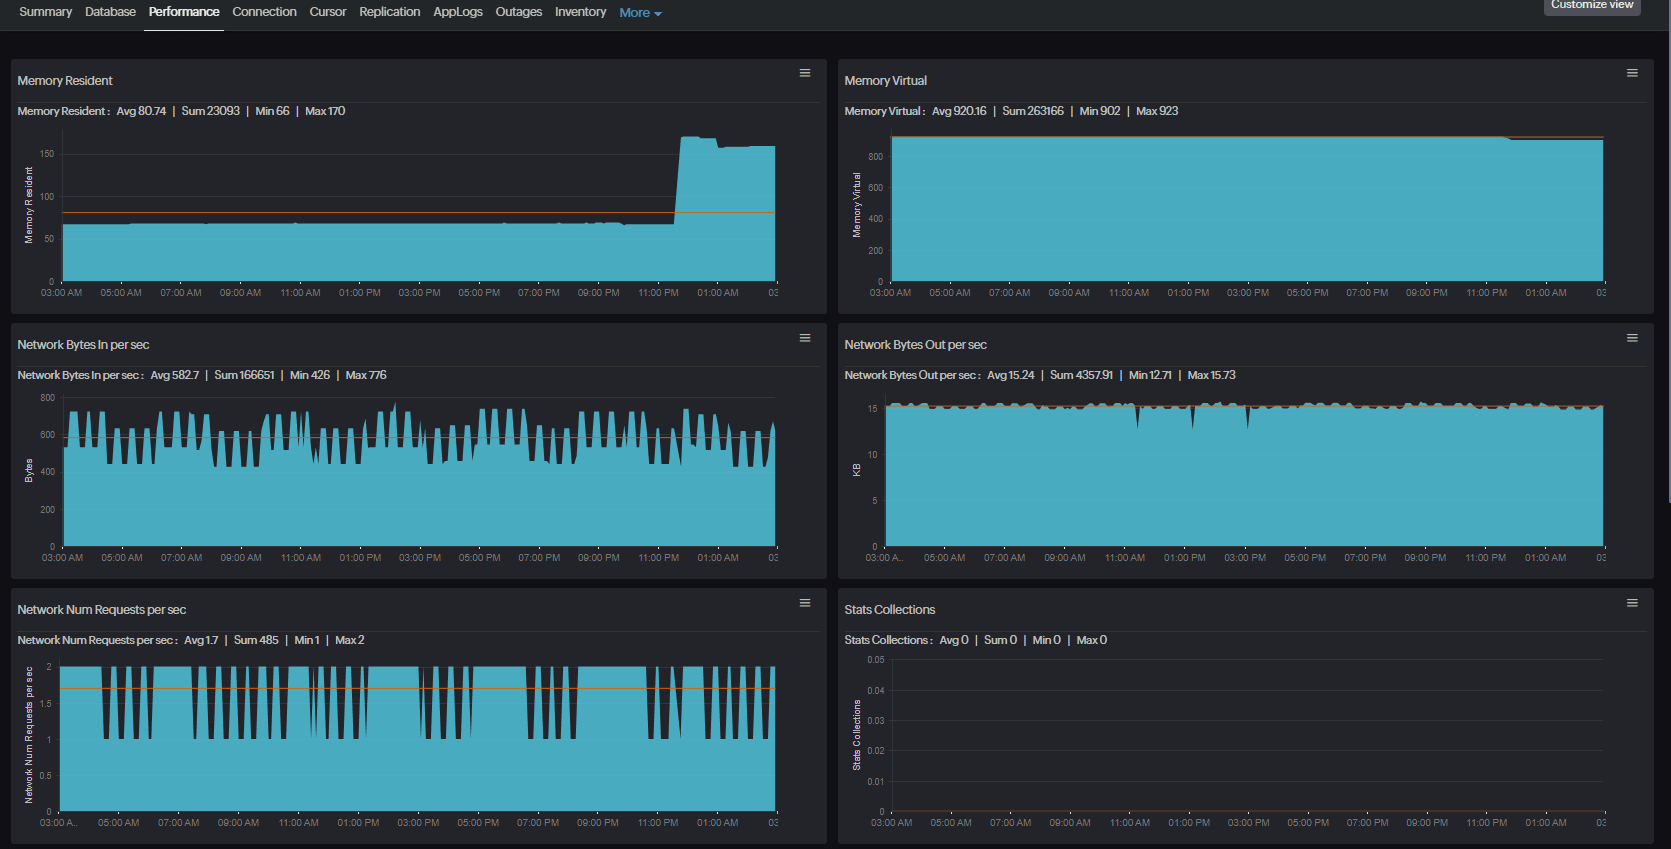
Extended metrics and tab support for complete visibility
The new interface includes dedicated tabs for Database, Connection, Cursor, and Replication, each providing relevant metrics for comprehensive analysis.
With this update, you can now access replication metrics from MongoDB as well, all within a unified dashboard.
Simplified installation with an installer for Linux
To install the MongoDB monitoring plugin on Linux servers, use the new MongoDB plugin installer. Simply execute the command below in your terminal. Then, follow the in-line instructions to complete the installation process.
wget https://raw.githubusercontent.com/site24x7/plugins/master/mongoDB/installer/Site24x7MongoDBPluginInstaller.sh && sudo bash Site24x7MongoDBPluginInstaller.sh
You can also access the script from our GitHub repository here.
If you want the standard installation of the plugin, view the README file of the MongoDB plugin in our GitHub repository and follow the installation steps.
Feel free to send in your feedback on the enhancement and the new installer in the comments section below.
Check out our growing list of over 100 plugin integrations to monitor your entire tech stack.
You can also build your own plugin to monitor any custom application, system, or service in your server.
Watch the video below to learn how to add a custom plugin for Linux servers.
Happy monitoring,
The Site24x7 team
Like (1)
Reply
Replies (0)