GICG: a deep-dive into how the Java garbage collector works and its benefits

Garbage collectors in Java, along with other programming languages such as C# and Python, are automated processes that run in the background to free up memory. Garbage collectors routinely identify and reclaim unused memory to stop memory leaks (unused objects still being referenced) and make applications more efficient and faster for end users.
This blog focuses on understanding the implementation and benefits of a widely used advanced method of garbage collection—the Garbage First Garbage Collector (G1GC). We'll look at the traits of G1GC and how it differs from previous versions of garbage collectors like Serial, Parallel, and the Concurrent Mark-and-Sweep collectors (CMS).
The evolution of Java garbage collectors
The Java virtual machine (JVM) controls the heap memory allocated by the system. The size of the heap memory available to the JVM is controlled by the JVM arguments -Xms<value> (initial minimum heap size) and -Xmx<value> (initial maximum heap size). When this heap memory is overused, the JVM cannot allocate space for newer objects and produces a java.lang.OutOfMemoryError exception. To prevent this memory exhaustion, Java has automatic programs called garbage collectors that divide the heap memory further into manageable chunks called regions, classified according to the age of the objects within. The types of regions depend on the generation of garbage collection.
There have been several generations of garbage collectors in Java. Serial GCs that were single-threaded, stop-the-world collectors for smaller applications. Parallel GCs, with multiple threads with reduced pause times to handle larger heaps. Concurrent Mark-and-Sweep (CMS) GCs with minimum pauses and concurrent marking and sweeping phases to ensure low-latency applications. From Java 6 onwards, G1GCs have come into the picture and become the default method of garbage collection since Java 11, along with concurrent and complete garbage sweep to suit very large applications with scalable workloads on multiprocessors with large memories. Choosing the right garbage collection method depends on the environment and the way you would like the cycle to be executed (stop-the-world pauses).
What is a G1GC?
As the name indicates, this garbage collector's first priority is clearing garbage. If we imagine the Java heap as one big room, the G1GC divides it into smaller sections and keeps a constant track of the trash (unused and defunct data). When the trash piles up, the G1GC cleans the garbage, beginning with sections with the most trash first. In doing so, the G1GC process runs intelligently to ensure low pause times without interrupting the work too often. While the time taken to remove garbage comes down with every cycle, the cycles also get predictable, enabling application designers to create high-throughput apps that are fast and always functional while keeping a check on memory usage.
How G1GC works
G1GC works in three steps: marking, evacuation, and compaction:
- First, the G1GC divides the heap memory into smaller regions to stay in control of garbage collection.
- Then, it marks all live objects. After marking, G1GC targets the regions with a high percentage of garbage. Afterward, it begins the evacuation process and copies live objects from the marked regions to those with more space.
- Finally, G1GC compacts the live objects in the new regions. By repeating the process, G1GC continuously cuts down on fragmentation to improve the performance of the heap drastically.
G1GC is considered a step ahead in terms of performance, compared to previous generations of Java garbage collectors, including the serial, parallel, and CMS types. While the earlier versions heap all structures into three sections—young, old, and permanent—of fixed memory sizes, G1GC is different. G1GC divides a large contiguous Java heap into multiple heap regions of equal sizes. A list of free regions (ranging from 1MB to 32MB) is assigned to either the young or old generation as needed, with certain subset roles assigned as Eden, Survivor, and Tenured. G1GC tracks the live data in each region, and when a collection is triggered, the regions with the most garbage are cleared. Out of a total of 2,048 regions, the ones that are freed up, go back to the free regions list, and the G1GC continues to compact the heap during collections, eliminating fragmentation issues by design.
Dynamic region sizing means young and old generations need not be contiguous, and the G1GC logically collects all non-contiguous regions to eliminate wastage, while saving time. While the earlier version, CMS garbage collectors, can only collect the old generation concurrently and needs to halt the application to collect the young generation. In contrast, the G1GC stops the app only at the beginning for a quick book-keeping step, and the app runs shortly after that, and the G1GC continues to work concurrently.
The G1GC process
Initial mark phase: G1GC marks the object roots in a stop the world process. This process is piggybacked–it happens simultaneously on a normal young garbage collection.
Root region scanning phase: The G1GC scans all survivor regions after the initial mark phase to refer them into the old generation and mark them as referenced objects. This is a concurrent action that happens along with app processes.
Concurrent marking phase: In another concurrent process, the G1GC scans for reachable (live) objects across the Java heap, which could be interrupted by a young garbage collection.
Remark phase: This is a final mark phase, a stop-the-world phase, in which all app threads are suspended to enable the G1GC to drain remaining buffers (snapshot-at-the-beginning algorithm) to trace any as-yet unvisited live object. G1GC also resets and returns empty regions to the free list.
Clean-up phase: The final phase in which the G1GC partly stops the world to identify completely free regions and mixed garbage collection candidate regions, and scrubs the remembered sets (RSets).
Tuning G1GC
Set your preferred GC Algorithm explicitly: It is recommended to explicitly set the required GC to the G1GC using this JVM Option: -XX:+UseG1GC
Set your GC choice explicitly to avoid wrong defaults if any, such as the parallel GC as default in Java 8, and the G1GC in Java 11.
Set your preferred heap size: It is recommended to set the minimum and maximum heap sizes explicitly to the same value to avoid dynamic shrinking and growing of the heap during the application’s life cycle.
-XX:InitialHeapSize — Minimum Java heap size
-XX:MaxHeapSize — Maximum Java heap size
Pause goal and young generation sizing
(-XX:MaxGCPauseMillis=size)
MaxGCPauseMillis sets the peak pause time expected in the environment. For example, to set the maximum GC pause time as 500 ms, choose (-XX:MaxGCPauseMillis=500). It is recommended to be between 500-2000 ms. Also, set the maximum value to the expected peak pause length, and not the target pause length. Remember that when adjusting the GC pause, there is always a trade-off between latency and throughput. While a longer pause increases latency and throughout, a shorter pause decreases them both.
Other recommended settings
- Set this value to disable processing of calls to the System.gc() method: -XX:+DisableExplicitGC
- Set string deduplication (disabled by default) to reduce memory footprint of string objects on the Java heap: -XX:+UseStringDeduplication
- Information about the time taken for processing of reference objects is shown in the Ref Proc and Ref Enq phases. During the Ref Proc phase, G1 updates the referents of reference objects according to the requirements of their particular type. In Ref Enq, G1 enqueues reference objects into their respective reference queue if their referents were found dead.
- If these phases take too long, consider enabling parallelization of these phases using: -XX:+ParallelRefProcEnabled.
Choose G1GC for:
- Handling large objects and applications with huge heap sizes, with a mix of both young and old objects.
- Eliminating frequent garbage collection routines that stop the cycle and hamper user experience.
- Applications that demand the lowest latency and highest uptime, such as financial and commercial applications.
- Multi-threaded applications, as G1GC takes full advantage of multiple CPU cores, improving app performance overall.
- Improving debugging, as G1GC makes it easier to diagnose and fix garbage collection issues.
- Reducing memory fragmentation while improving heap utilization and eliminating unnecessary garbage collection cycles.
G1GC is a powerful and efficient garbage collector. Several applications use G1GC for their many benefits. For example, the NoSQL database Apache Cassandra and search engine ElasticSearch use to manage their large heap and provide low latency. The popular messaging system Apache Kafka and data processing engine Apache Spark use G1GC to manage their large heap and ensure high throughput.
Using Site24x7 to monitor GC time
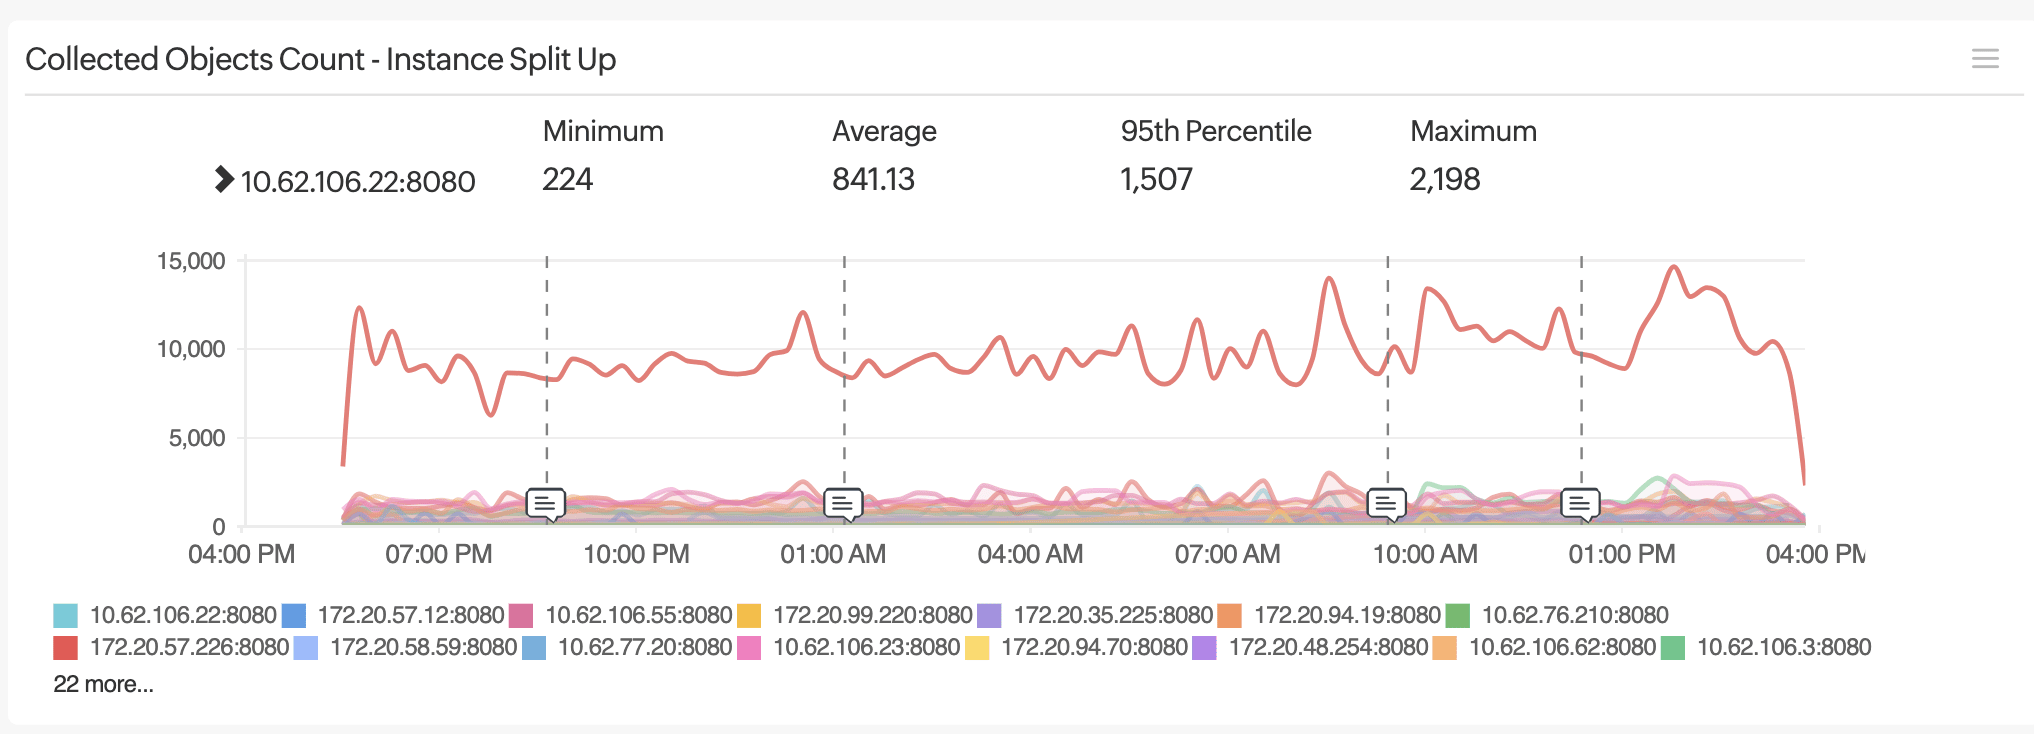
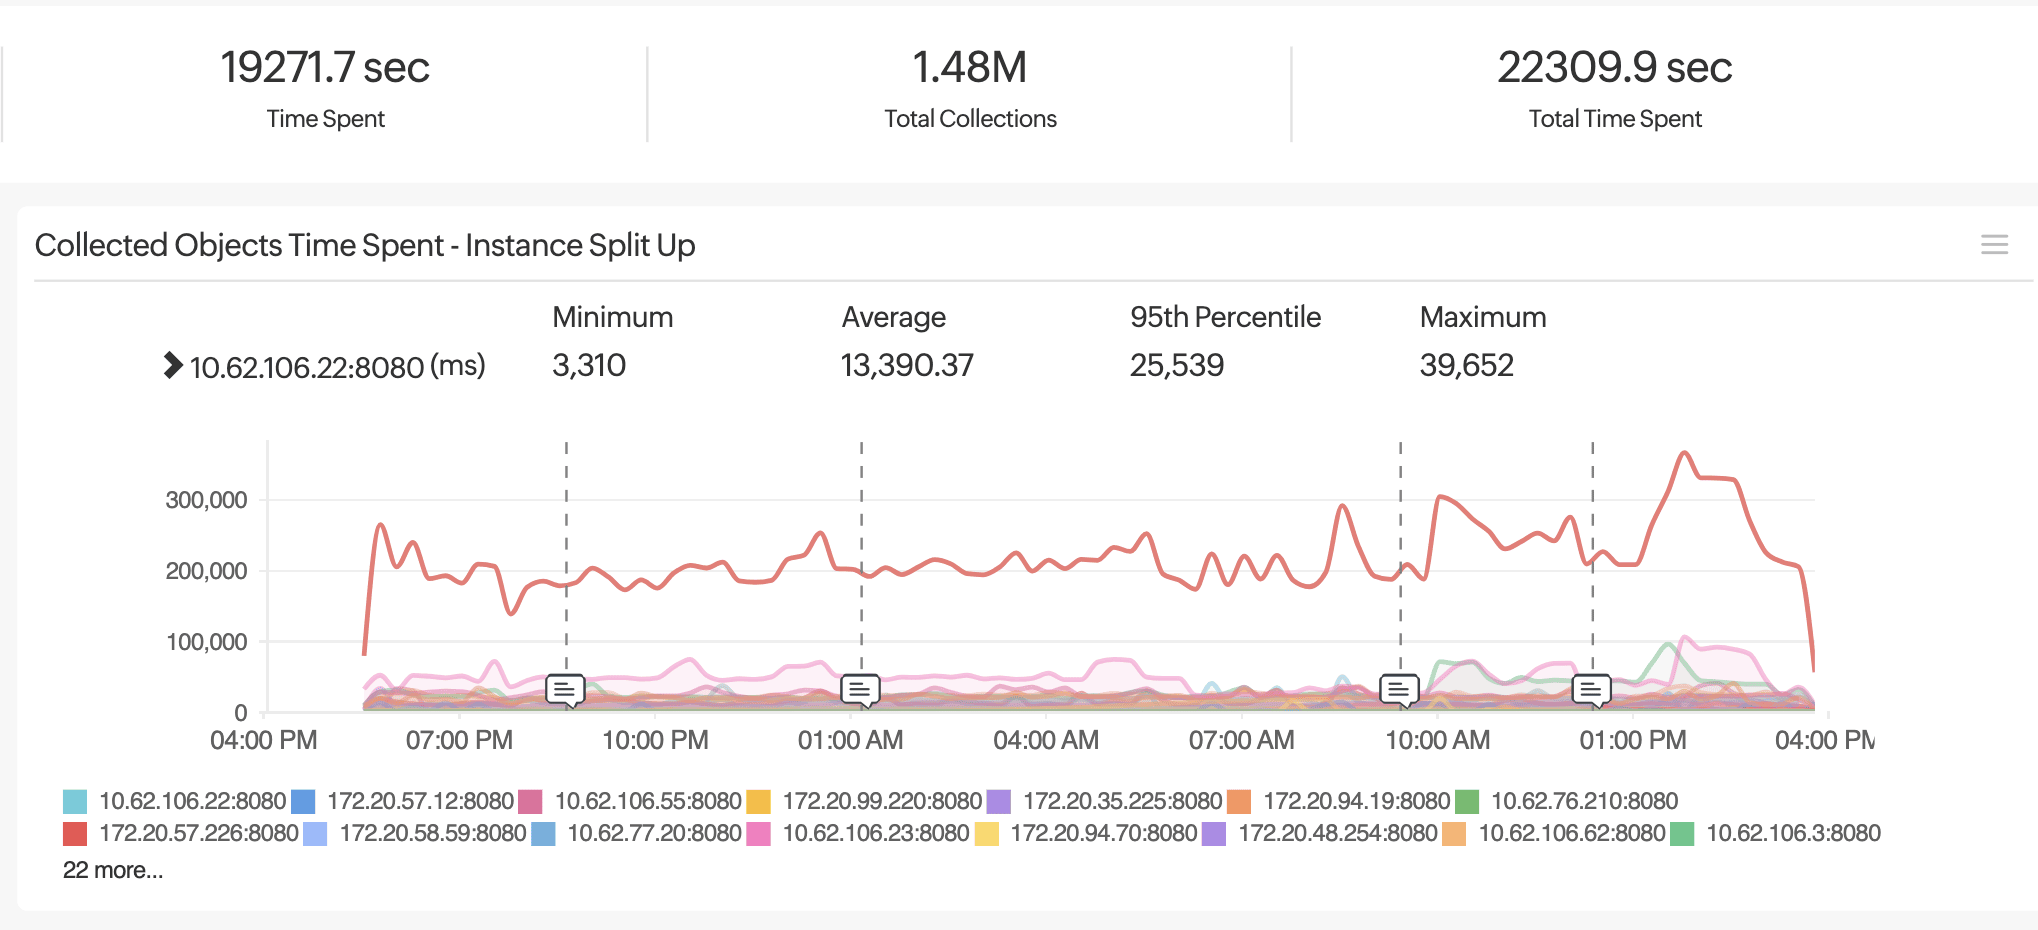
ManageEngine Site24x7’s APM Insight offers GC insights that helps you see historical data, and compare the metrics between scenarios. You can use Site24x7 to track the time spent and count for your GC instances. Also, use Site24x7 to set alerts to notify you whenever GC collection time exceeds a set limit, to ensure adequate memory provisioning is done to ensure smooth functioning of the application.


Please note that, before switching your GC cycle to G1GC, it is advisable to make use of Site24x7’s milestone markers to capture the GC stats, and compare them with the metrics post implementation. This ensures that the move to G1GC has been validated.
Conclusion
Overall, the adaptive sizing, concurrent full garbage collection, and garbage-first approach of G1GC significantly improve performance and minimize the impact of garbage collection on your Java applications. As a result, G1GC helps achieve a substantial improvement in overall user experience, creating a positive impact on businesses.
Comments (0)